Explore users behavior with transition matrix
This notebook can be found here
or open directly in google colab.
Before you start
To start with these tools, you need to upload your own .csv with clickstream data (as described in Getting started) or you can use the retentioneering.datasets.load_simple_shop() for our sample dataset.
So for the first step please make sure you have Retentioneering imported and dataframe with your clickstream is created, and by calling retentioneering.config.update you defined for the library where the essential user_col, event_col, event_time_col are located in your loaded dataframe:
import retentioneering

# load sample user behavior data as a pandas dataframe:
data = retentioneering.datasets.load_simple_shop()

# update config to pass columns names:
retentioneering.config.update({
    'user_col': 'user_id',
    'event_col':'event',
    'event_time_col':'timestamp',
})
Explore users transitions between events with adjacency matrix
get_adjacency function and its options
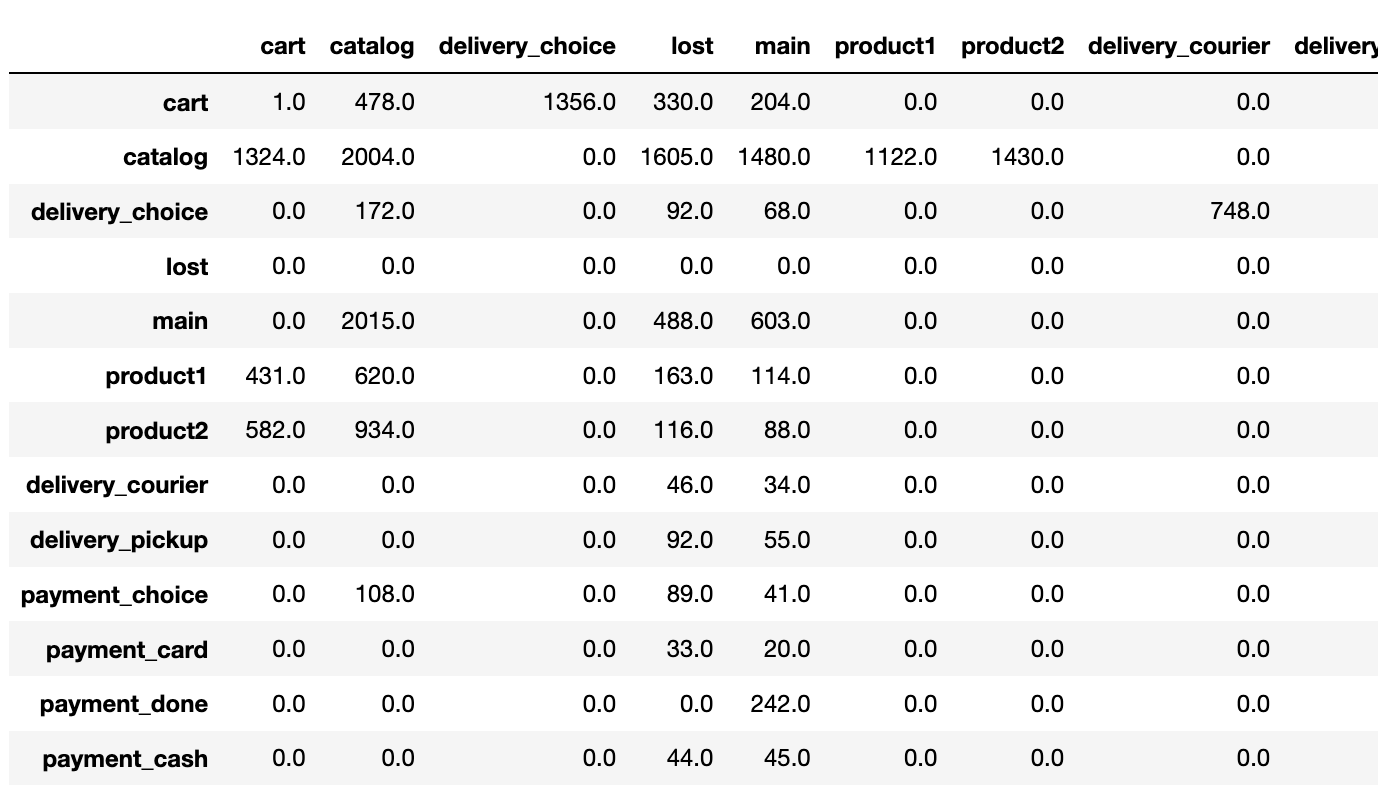
Similar approch as we had used with plot_graph() we may apply to explore the transitions in form of dataframe. Every graph can be represented as a matrix (table or dataframe). Your data have transitions of many users, we can strictly count how many users have certain transitions and build the table, where every row correspond to the origin event from which transition is made, and the columns correspond to destination event. Therefore, every cell of this table correspond to particular graph edge.
Please note, that diagonal cells correspond to loops: transition from the node to itself. Typical example is the navigation with online shop where user goes from one catalog page to another catalog page.
The dataframe with this table, formally defined as adjacency matrix, because it reveales how the graph nodes are connected with edges, can be build by Retentioneering get_adjacency() function. Its arguments weight_col and norm_type are analogous to plot_graph() function, (read mode about these arguments in visualization tool descriptions) As we want to explore how many users of our clickstream dataset had particular transition, we can run it with weigh_col=’user_id’ and norm_type=None:
data.rete.get_adjacency(weight_col='user_id', norm_type=None)

The beauty of this function is that it returns dataframe you can farther work with in a very convinient way:
df=data.rete.get_adjacency(weight_col='user_id', norm_type=None)
Now we can select only nodes from which at least some users (more than 0) had transitions into the cart:
df[df['cart']>0]

Or how many users had reached the cart in total:
df['cart'].sum()