Transition matrix#
The transition matrix shows the frequencies of a transition between a pair of events. It is strongly connected to transition graph. Each value of a transition matrix is essentially an edge weight of the corresponding transition graph. For example, the weight of A → B transition is located at A row and B column of the transition matrix. See the this and this section of the transition graph user guide for the details.
Loading data#
Throughout this guide we use our demonstration simple_shop dataset. It has already been converted to Eventstream and assigned to stream variable. If you want to use your own dataset, upload it following this instruction.
from retentioneering import datasets

stream = datasets.load_simple_shop()
A basic example#
Similar to transition graph’s parameters edges_norm_type and edges_weight_col, transition matrix has norm_type and weight_col arguments. The default parameters are norm_type=None and weight_col='user_id'.
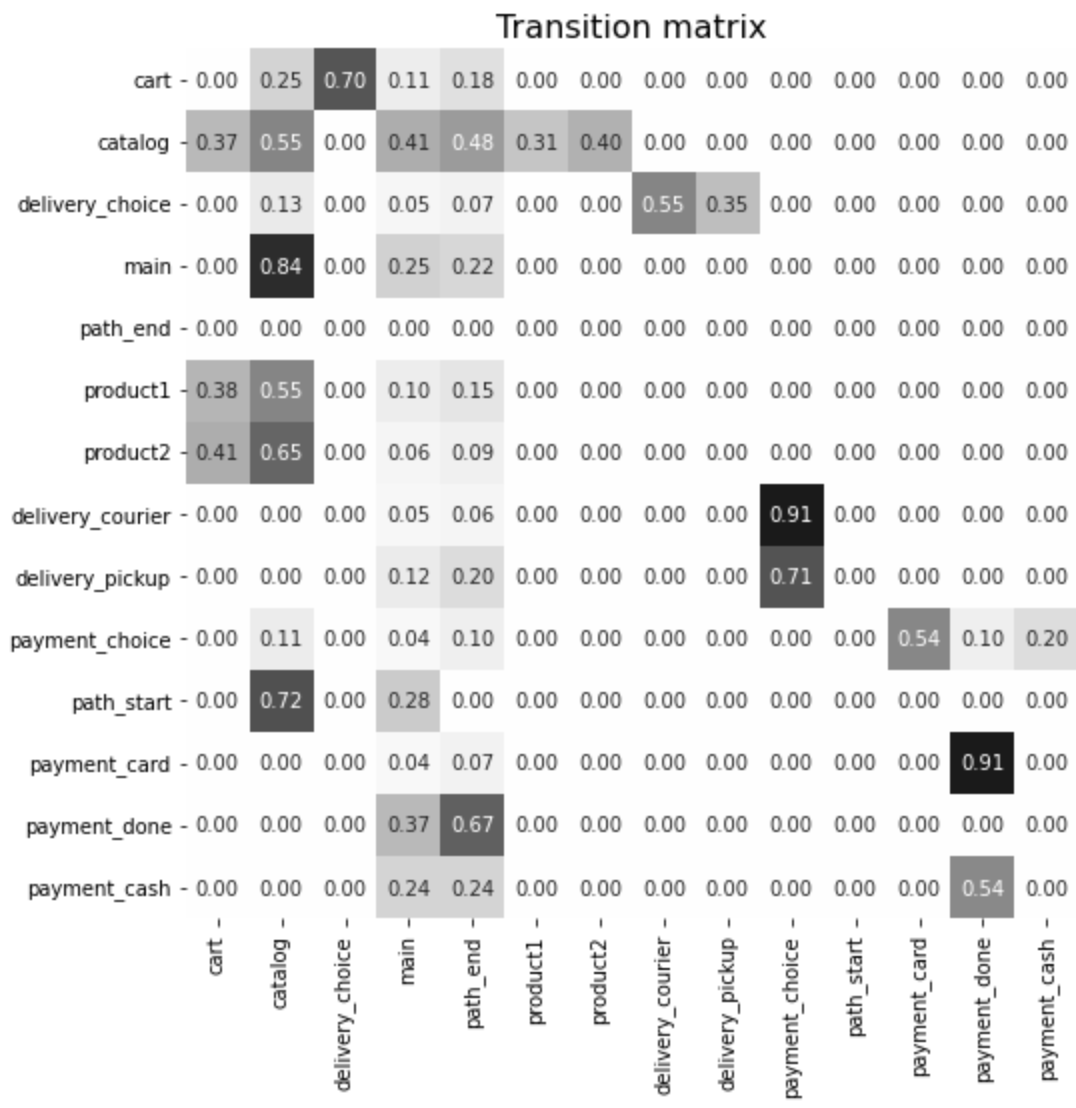
stream.transition_matrix(norm_type='node', weight_col='user_id')

For example, from this matrix we can see that with respect to norm_type='node' and weight_col='user_id' configuration, the weight of the edge cart → catalog is 25% meaning that 25% of the users who had cart event had also cart → catalog transition.
There are some arguments that control the appearance of a transition matrix.
By default, we do not recommend to plot any matrix of dimension > 60. To override this, you can set
show_large_matrix=Trueexplicitly.Matrix values are displayed if the matrix dimension is <= 30, and not displayed otherwise. To show or hide them explicitly use
show_valuesflag.The
precisionargument sets the number of digits after the decimal point.heatmap_axisallows you to color each row or each column by with a separate heatmap.
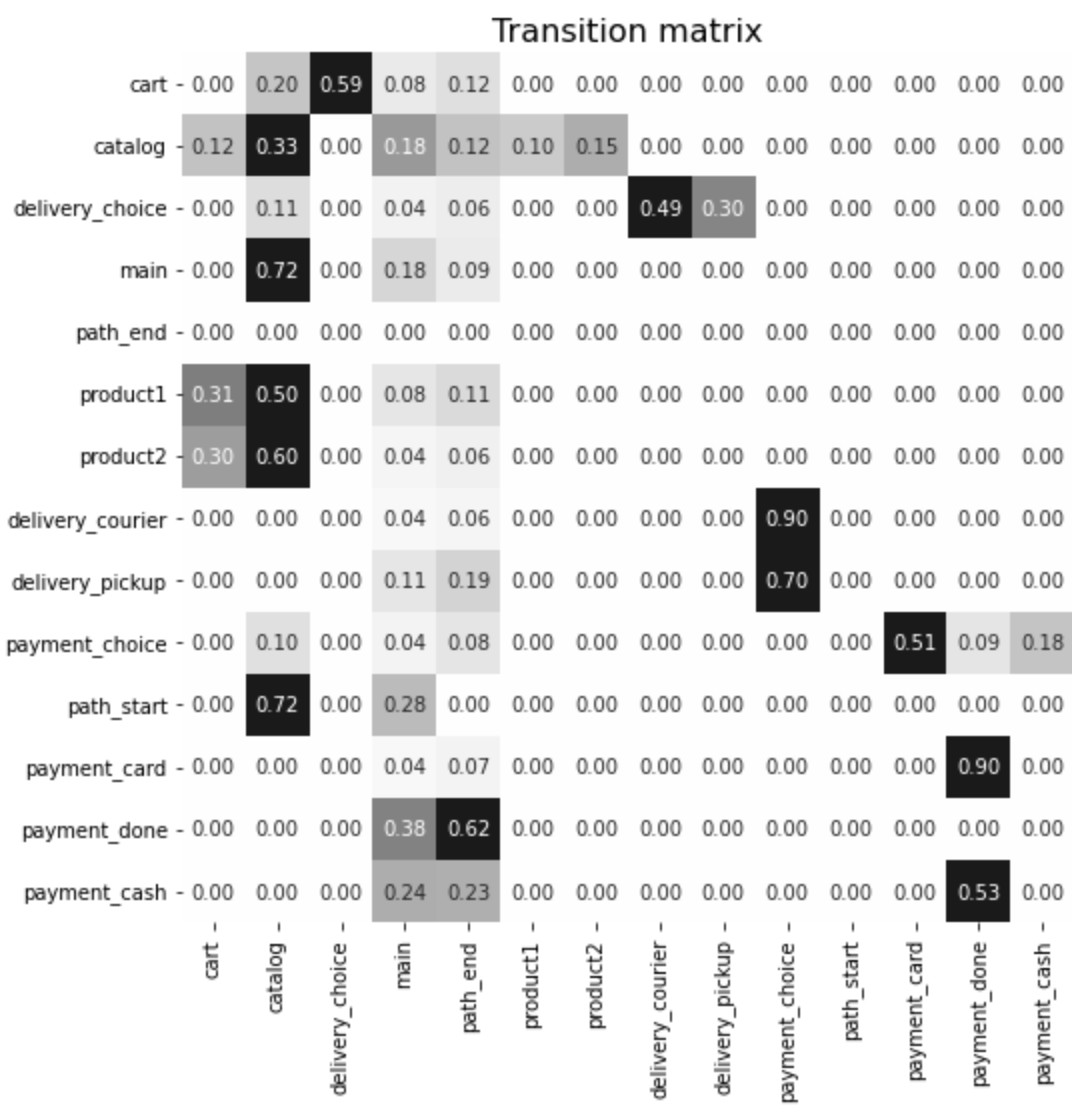
stream.transition_matrix(norm_type='node', weight_col='event_id', heatmap_axis=0)

This is a row-wise heatmap of the Markov matrix (norm_type='node', weight_col='event_id') that highlights the basic property of Markov transition matrix: the sum of each row equals to 1.
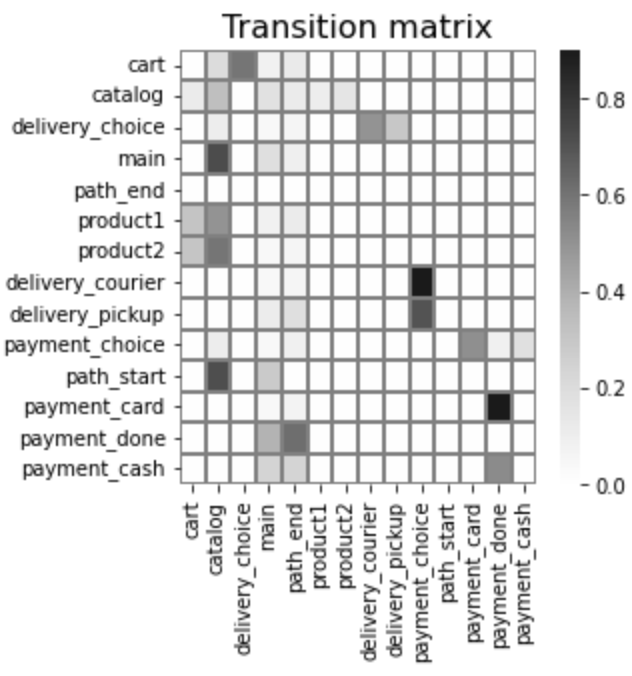
The next example demonstrates how to hide the cell values and make the image smaller:
stream.transition_matrix(
    norm_type='node', weight_col='event_id',
    show_values=False, figsize=(4, 4)
)

Differential transition matrix#
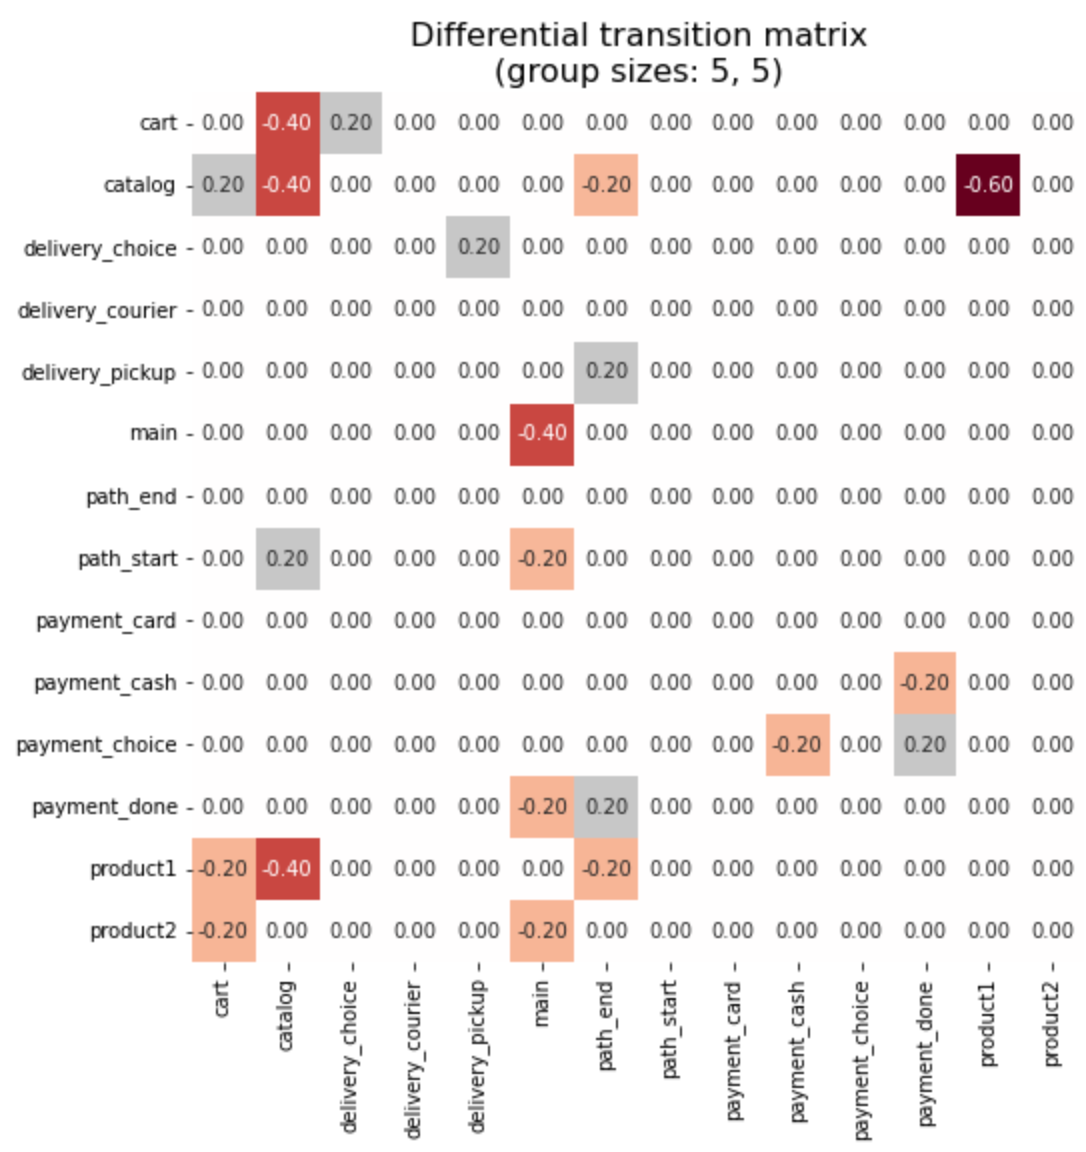
Similar to some other tools (e.g. step matrix, funnels, sequences), transition matrix supports comparison of two groups of users. If M1 and M2 are transition matrices for the first and the second groups then the differential matrix is defined as M1 - M2.
The groups argument defines the groups of paths to compare. You can pass either a collection of two collections containing path ids, or a couple of pre-defined segment values. The latter option is often preferable since pre-defined segments allows you to compare the same groups using other Retentioneering tools too. For example, if you have a segment country you can compare the users from the US and the UK like this:
stream.transition_matrix(groups=['has_payment_done', 'US', 'UK'])
See the segments user guide for more details on how to create and use segments.
If you do not want to create a segment explicitly, you can pass a pair of collections containing path ids on the fly like this:
group1 = [39690243, 56229892, 770891782, 189849617, 345530386]
group2 = [950233183, 681437279, 816957536, 913156199, 614680680]

stream.transition_matrix(
    weight_col='user_id', norm_type='full',
    groups=[group1, group2]
)

Using a separate instance#
Eventstream.transition_matrix() returns an instance of TransitionMatrix class that have values attribute so you can get the transition matrix as a pandas.DataFrame. To supress plotting the heatmap matrix, use show_plot=False flag.
tm = stream.transition_matrix(show_plot=False)
tm.values
| cart | catalog | ... | payment_done | payment_cash | |
|---|---|---|---|---|---|
| cart | 1.0 | 571.0 | ... | 0.0 | 0.0 |
| catalog | 1709.0 | 4857.0 | ... | 0.0 | 0.0 |
| ... | ... | ... | ... | ... | ... |
| payment_done | 0.0 | 0.0 | ... | 0.0 | 0.0 |
| payment_cash | 0.0 | 0.0 | ... | 104.0 | 0.0 |