Data processors user guide#
![]()

Creating an eventstream#
Throughout this guide we use our demonstration simple_shop dataset. It has already been converted to Eventstream and assigned to stream variable. If you want to use your own dataset, upload it following this instruction.
import pandas as pd
from retentioneering import datasets

stream = datasets.load_simple_shop()
What is a data processor?#
Data processor is a class that can modify eventstream data in some special and narrow way. For example, data processors can filter events, add some artificial but useful events, truncate user paths according to custom logic, and much more. Data processors are designed to be nodes of a Preprocessing graph, which allows us creating complex data processing pipelines.
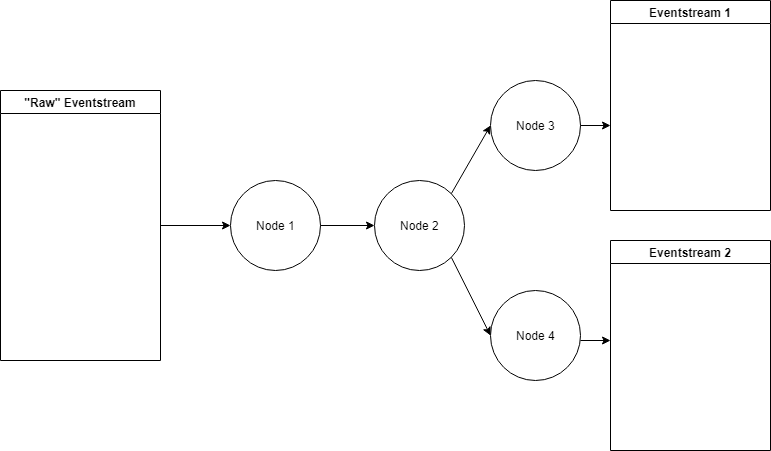
An outline of a preprocessing graph#
Helpers and chaining usage#
A helper is an Eventstream method that applies a single data processor to the eventstream data and returns a new modified eventstream.
Essentially, it is a shortcut for the cases when you want to avoid creating a preprocessing graph.
Since an outcome of a helper method is a new eventstream, it is convenient to use method chaining code style
as it is present in other python libraries, such as Pandas, PySpark, etc. For example, here is how to apply AddStartEndEvents and SplitSessions sequentially:
res = stream\
    .add_start_end_events()\
    .split_sessions(timeout=(10, 'm'))\
    .to_dataframe()
res[res['user_id'] == 219483890]
| event_type | event_index | event | timestamp | user_id | session_id | |
|---|---|---|---|---|---|---|
| 0 | path_start | 0 | path_start | 2019-11-01 17:59:13 | 219483890 | 219483890_1 |
| 2 | session_start | 2 | session_start | 2019-11-01 17:59:13 | 219483890 | 219483890_1 |
| 3 | raw | 3 | catalog | 2019-11-01 17:59:13 | 219483890 | 219483890_1 |
| ... | ... | ... | ... | ... | ... | ... |
| 11 | session_end | 11 | session_end | 2019-11-01 17:59:32 | 219483890 | 219483890_1 |
| 6256 | session_start | 6256 | session_start | 2019-12-06 16:22:57 | 219483890 | 219483890_2 |
| ... | ... | ... | ... | ... | ... | ... |
| 23997 | session_end | 23997 | session_end | 2020-02-14 21:04:52 | 219483890 | 219483890_4 |
| 23998 | path_end | 23998 | path_end | 2020-02-14 21:04:52 | 219483890 | 219483890_4 |
Hereafter we will use helpers instead of original data processor classes due to simplicity reasons. See some more complex examples of preprocessing here and here.
Data processors library#
The table below summarizes all the data processors implemented in retentioneering library.
Data processor
Helper
|
What it does |
|---|---|
AddStartEndEvents
|
Add two synthetic events in each user’s path:
|
SplitSessions
|
Cut user path into sessions and adds synthetic
events |
LabelNewUsers
|
Add synthetic event |
LabelLostUsers
|
Add synthetic event |
AddPositiveEvents
|
Add synthetic event |
AddNegativeEvents
|
Add synthetic event |
LabelCroppedPaths
|
Add synthetic events |
FilterEvents
|
Remove events from an eventstream. |
DropPaths
|
Remove a too short user paths (in terms of number of events or time duration). |
TruncatePaths
|
Leave a part of an eventstream between a couple of selected events. |
GroupEvents
|
Group given events into a single synthetic event. |
GroupEventsBulk
|
Apply multiple grouping rules simultaneously. |
CollapseLoops
|
Group sequences of repetitive events with new
synthetic events. E.g. |
Pipe
|
Apply a custom operation to an eventstream as if it is a pandas DataFrame |
Data processors can be partitioned into three groups:
Adding: processors that add events to an eventstream;
Removing: processors that remove events from an eventstream;
Editing: processors that modify existing events in an eventstream (including grouping operations).
In the next sections we organise our narrative according to these partitions.
Adding processors#
The processors of that type add some artificial (we also call them synthetic) events to an eventstream. Let us go through each of them.
AddStartEndEvents#
For each user, AddStartEndEvents
generates an event called path_start right before the first user event, and an event
path_end right after the last user event.
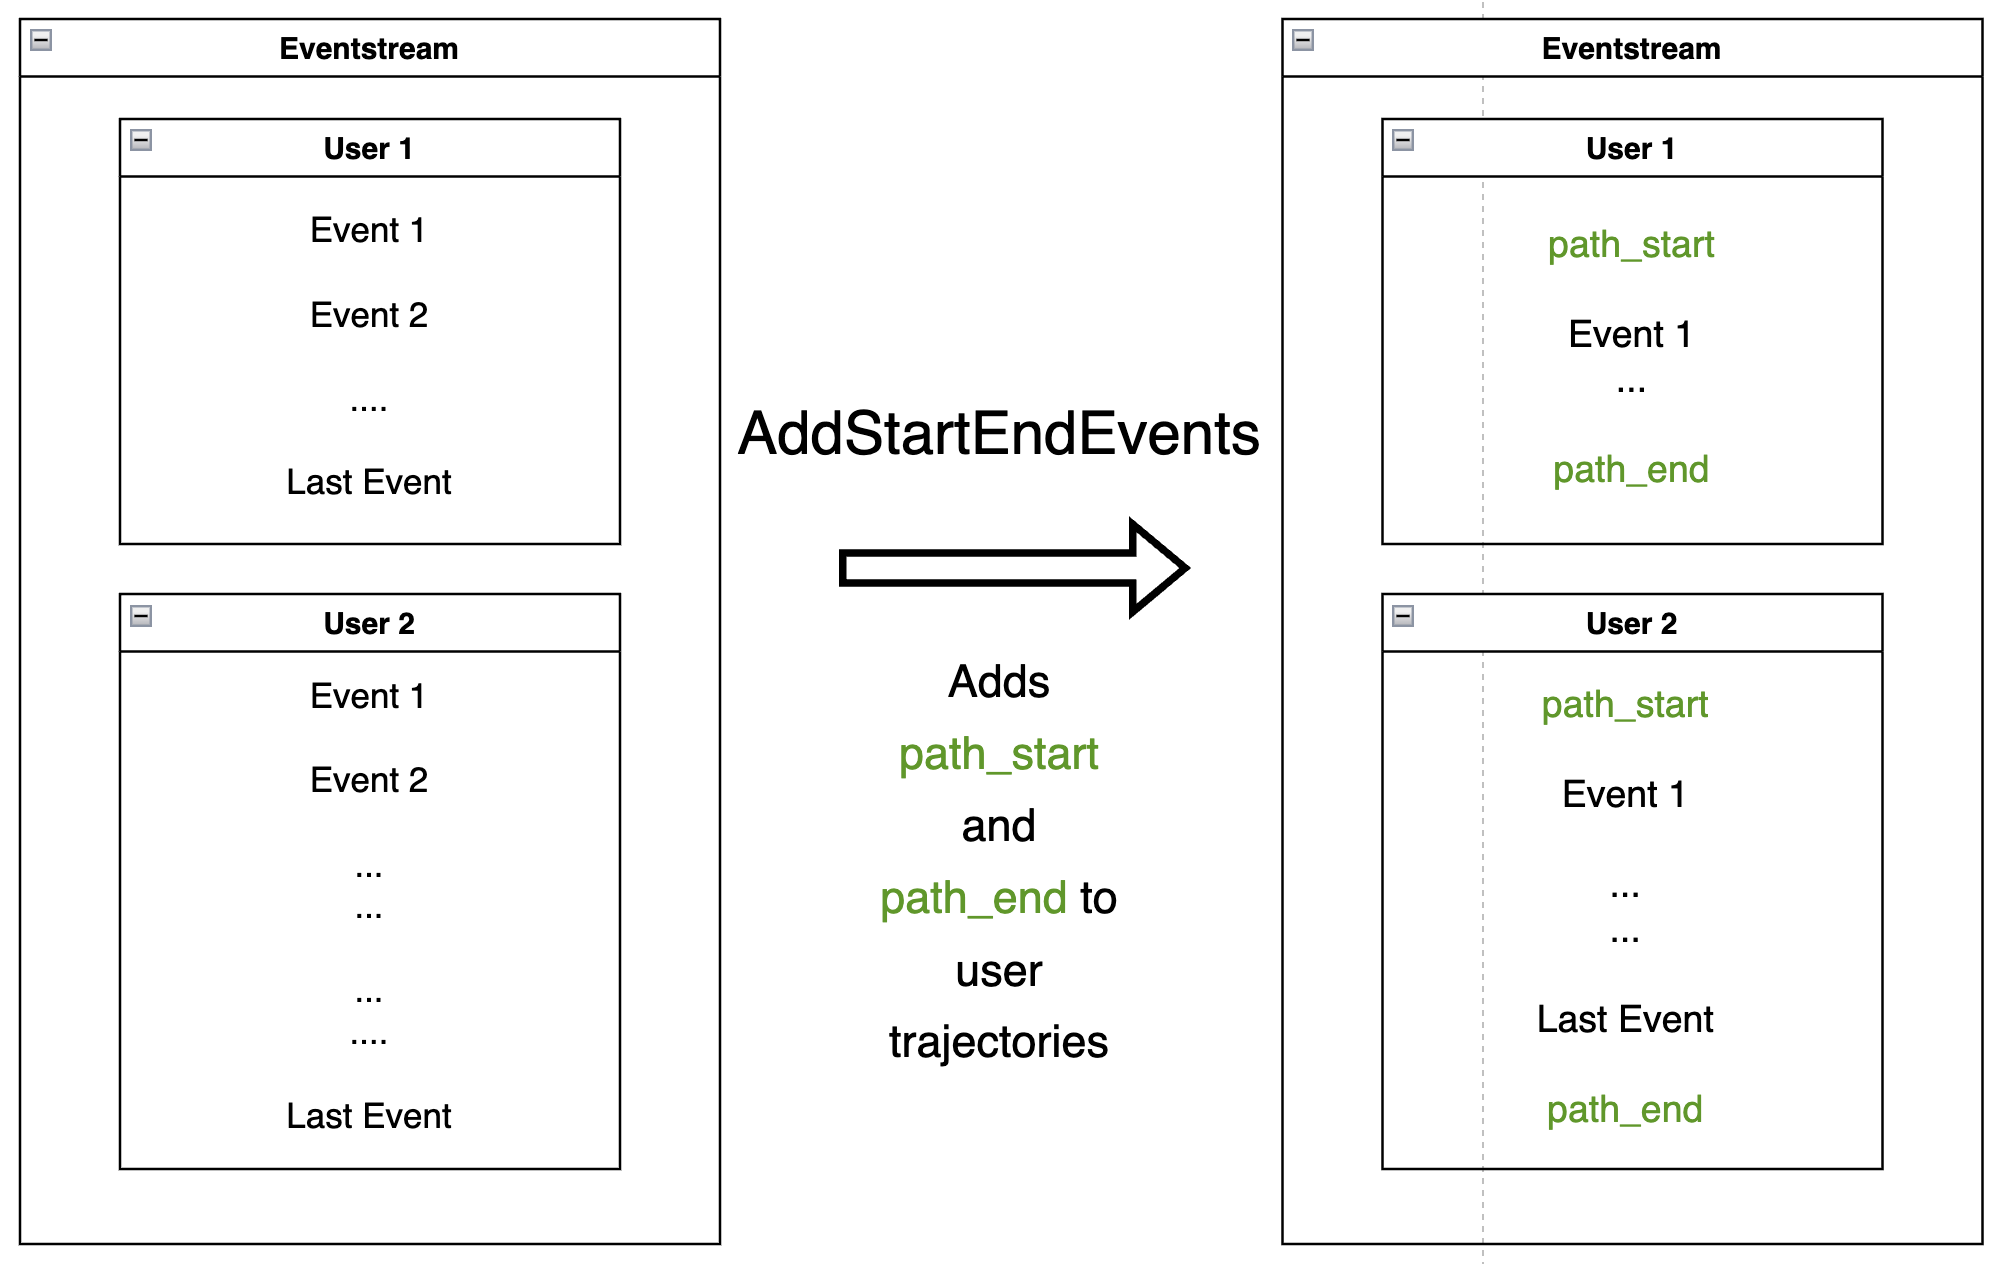
Applying AddStartEndEvents to mark user trajectory start and finish:
res = stream.add_start_end_events().to_dataframe()
res[res['user_id'] == 219483890]
| event_type | event_index | event | timestamp | user_id | |
|---|---|---|---|---|---|
| 0 | path_start | 0 | path_start | 2019-11-01 17:59:13 | 219483890 |
| 1 | raw | 1 | catalog | 2019-11-01 17:59:13 | 219483890 |
| ... | ... | ... | ... | ... | ... |
| 10213 | path_end | 10213 | path_end | 2020-02-14 21:04:52 | 219483890 |
As the DataFrame above shows, the generated events path_start
and path_end have identical timestamps as the corresponding first and
last events.
Note
We recommend applying this data processor each time you analyze an eventstream - since it explicitly sets the borders of an eventstream. It can help displaying user paths in TransitionGraph, StepMatrix, and StepSankey tools or calculating user lifetime.
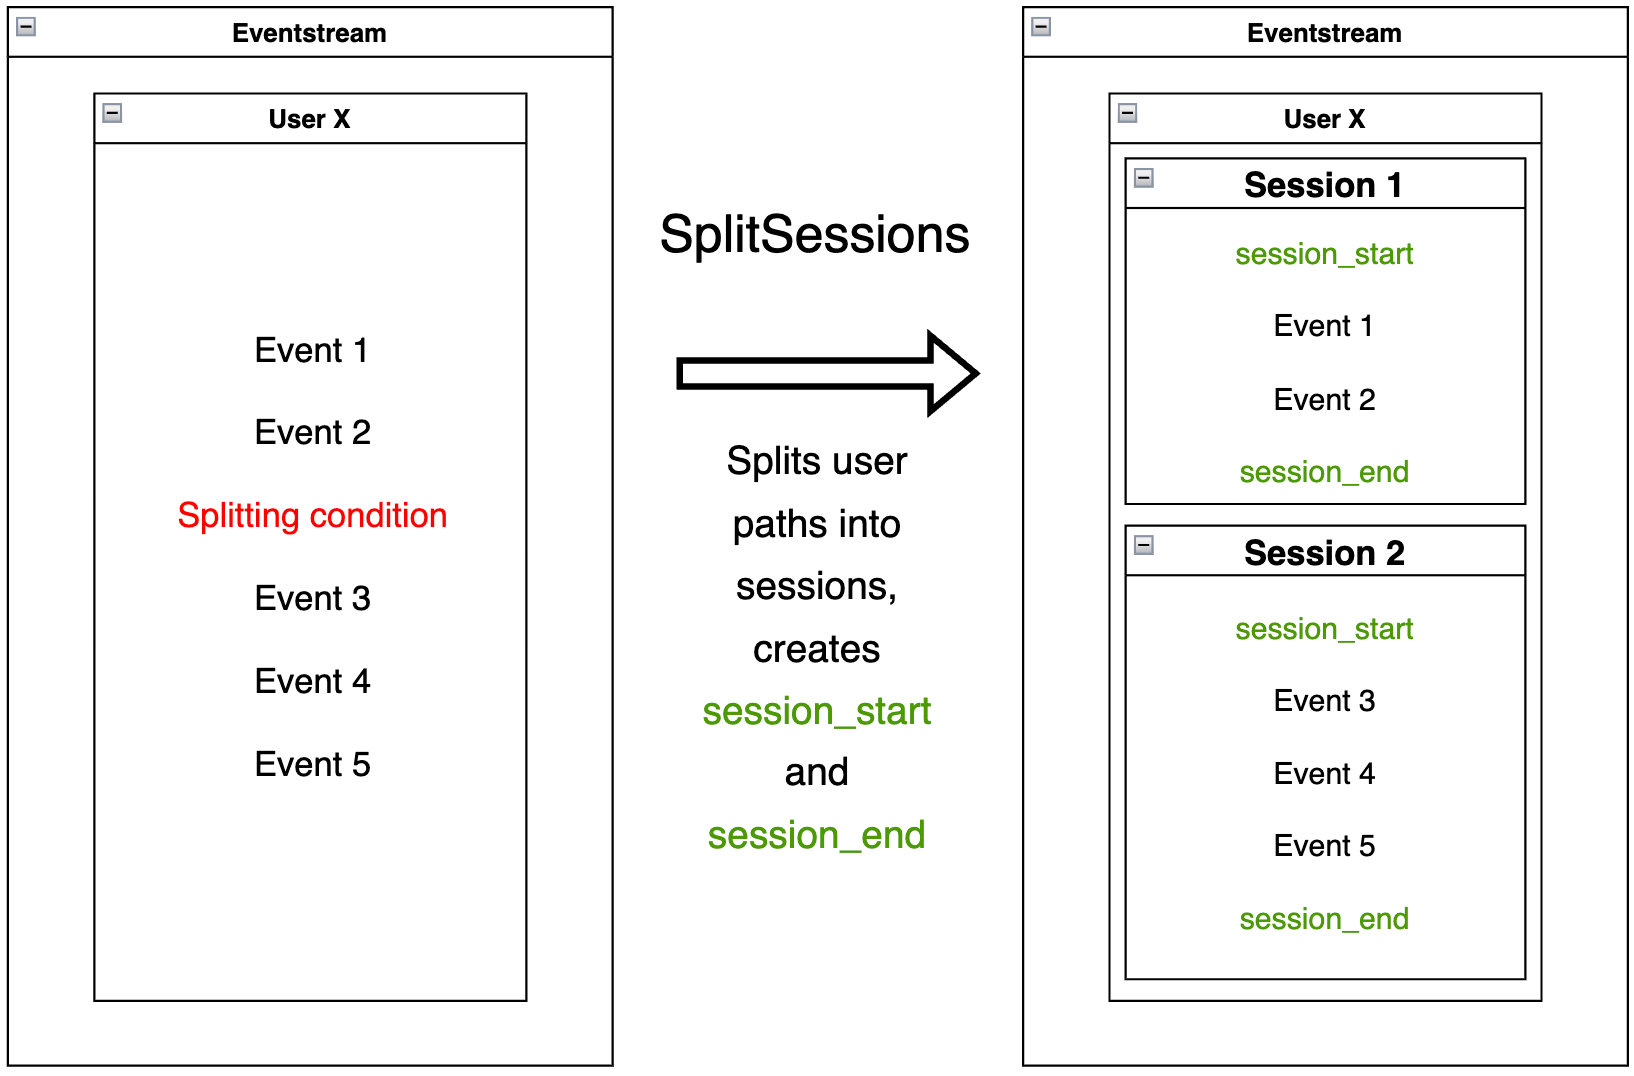
SplitSessions#
SplitSessions
data processor splits user paths into sessions according to some splitting condition.
For each session, it creates a couple of synthetic events session_start and
session_end, similar to AddStartEndEvents. Session identifiers are formed according to the
template <user_id>_<user_session_number> and can be found in the column defined by
session_id parameter. The user_session_number is associated with a session ordinal
number within a user path and always starts with 1.
The splitting condition might be 3-fold:
based either on timeout between two consecutive events (
timeoutparameter)based on a custom delimiting event or a pair of events (
delimiter_eventsparameter)based on a column that already contains session identifiers (
delimiter_colparameter).
Below is an example of applying SplitSessions with 10 minutes timeout:
res = stream.split_sessions(timeout=(10, 'm')).to_dataframe()
res[res['user_id'] == 219483890]
| event_type | event_index | event | timestamp | user_id | session_id | |
|---|---|---|---|---|---|---|
| 0 | session_start | 0 | session_start | 2019-11-01 17:59:13 | 219483890 | 219483890_1 |
| 1 | raw | 1 | catalog | 2019-11-01 17:59:13 | 219483890 | 219483890_1 |
| ... | ... | ... | ... | ... | ... | ... |
| 9 | session_end | 9 | session_end | 2019-11-01 17:59:32 | 219483890 | 219483890_1 |
| 5316 | session_start | 5316 | session_start | 2019-12-06 16:22:57 | 219483890 | 219483890_2 |
| ... | ... | ... | ... | ... | ... | ... |
| 21049 | session_end | 21049 | session_end | 2020-02-14 21:04:52 | 219483890 | 219483890_4 |
The result for one user is displayed above. We see that the user trajectory is partitioned into three sessions. The time distance between consecutive events within each session is less than 10 minutes.
Note
In order to estimate appropriate value of timeout parameter, Eventstream.timedelta_hist() might be useful.
Suppose you have some events indicating the start and end of a session. You can define them in the delimiter_events parameter, so that SplitSessions can split sessions according to their occurrence. Note that the delimiting events will be replaced with session_start and session_end synthetic events. See an example in the SplitSessions documentation.
Also, sometimes you have pre-defined session splitting, so that a special column contains session identifiers. In this case you can pass this column name to delimiter_col parameter. session_start and session_end events will be added according to your custom session splitting. See an example in the SplitSessions documentation.
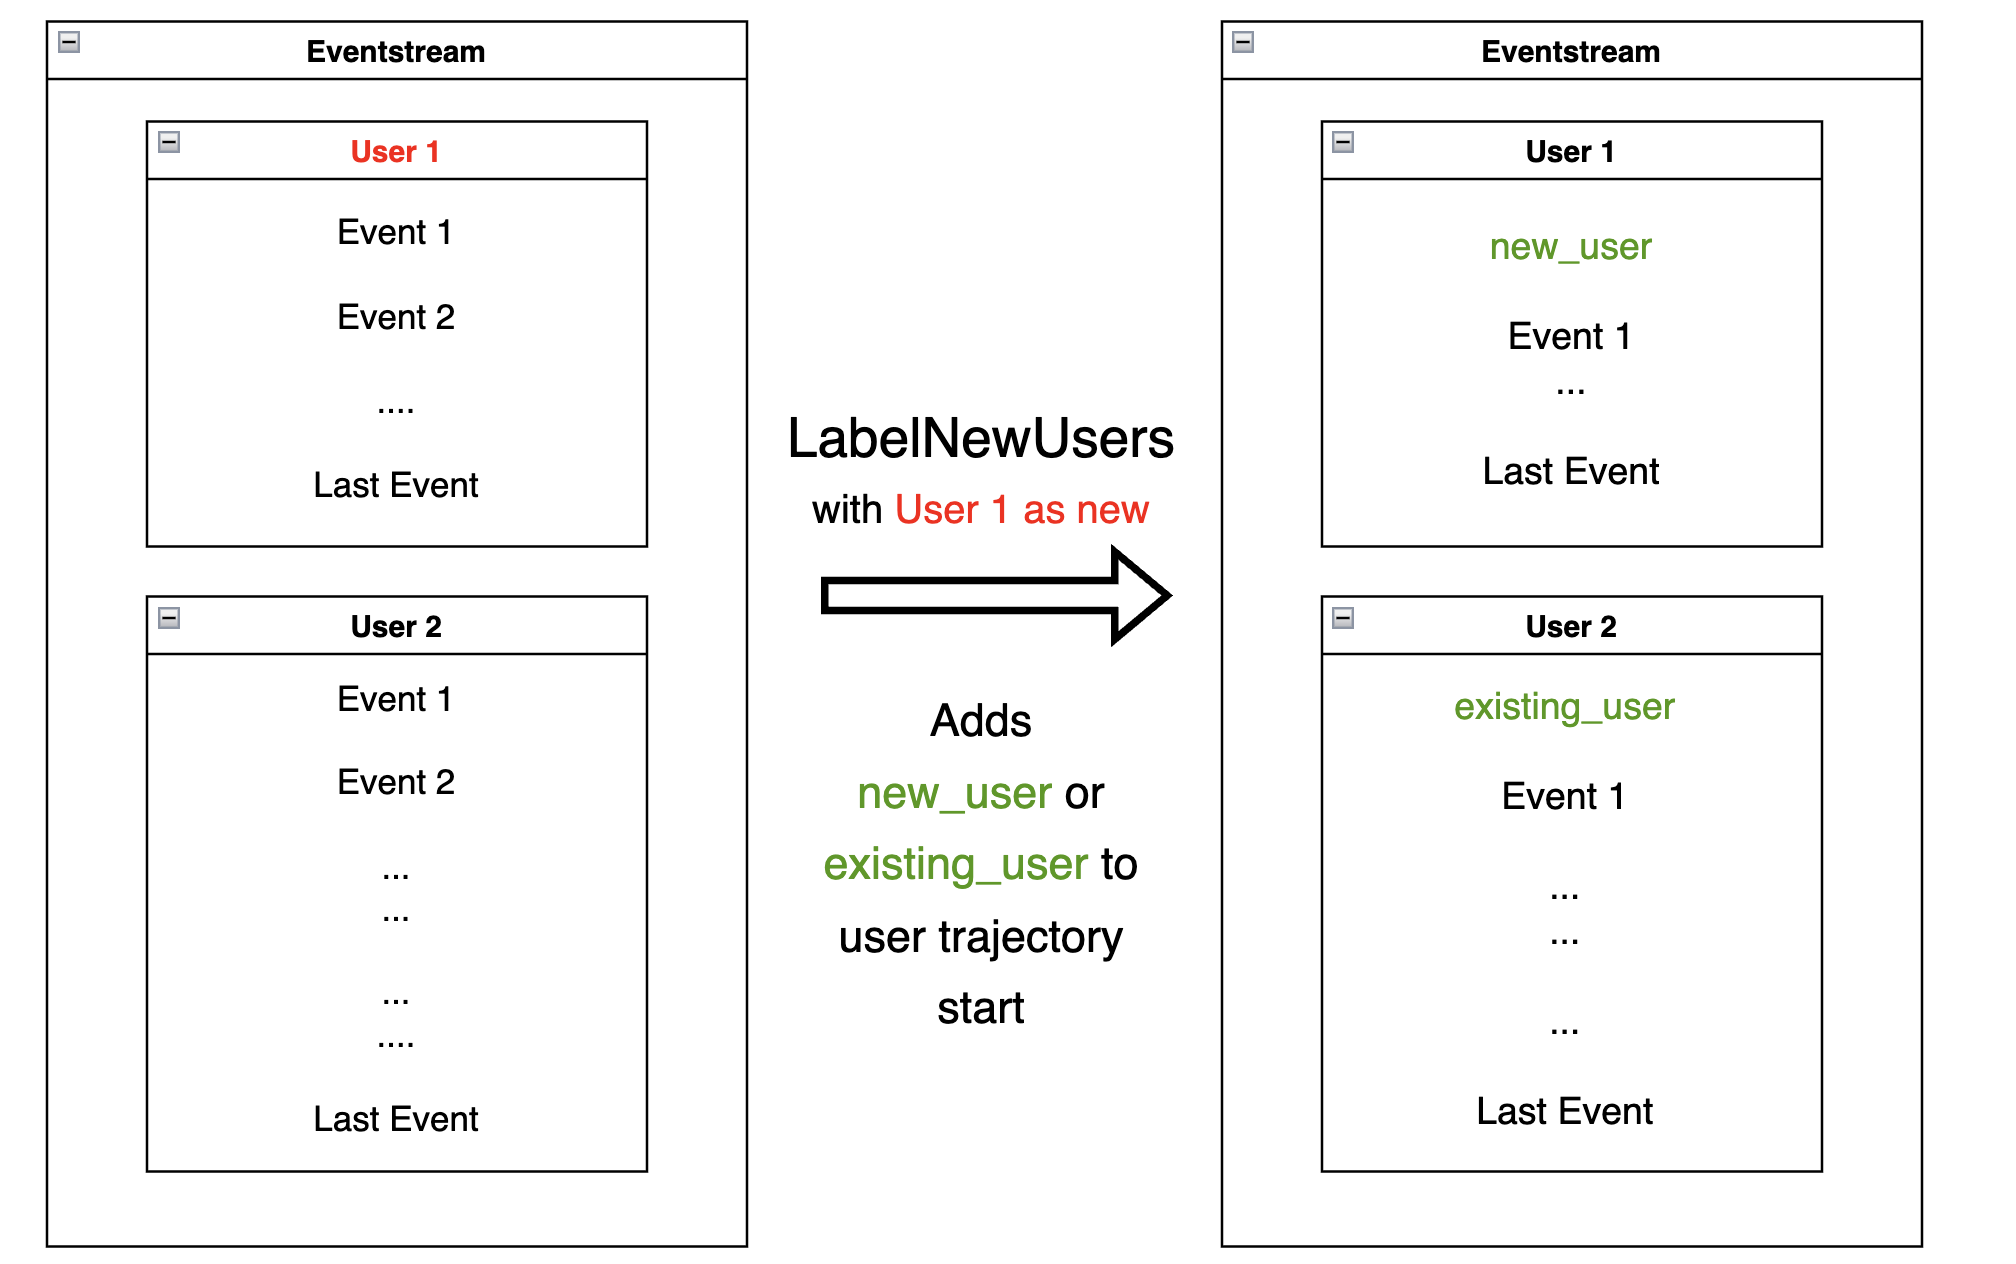
LabelNewUsers#
Given a list of users (considered “new”), the
LabelNewUsers
data processor labels those users in an eventstream by adding a synthetic new_user
event to each user trajectory start. For all other users, adds an
existing_user synthetic event. All users will be labeled as new when
passed ‘all’ instead of a list.
new_users = [219483890, 964964743, 965024600]
res = stream.label_new_users(new_users_list=new_users).to_dataframe()
res[res['user_id'] == 219483890].head()
| event_type | event_index | event | timestamp | user_id | |
|---|---|---|---|---|---|
| 0 | new_user | 0 | new_user | 2019-11-01 17:59:13 | 219483890 |
| 1 | raw | 1 | catalog | 2019-11-01 17:59:13 | 219483890 |
| 2 | raw | 2 | product1 | 2019-11-01 17:59:28 | 219483890 |
| 3 | raw | 3 | cart | 2019-11-01 17:59:29 | 219483890 |
| 4 | raw | 4 | catalog | 2019-11-01 17:59:32 | 219483890 |
We can see that user 219483890 is marked as a new user.
But user 501098384 is marked as an existing user:
res[res['user_id'] == 501098384].head()
| event_type | event_index | event | timestamp | user_id | |
|---|---|---|---|---|---|
| 17387 | existing_user | 17387 | existing_user | 2020-04-02 05:36:04 | 501098384 |
| 17388 | raw | 17388 | main | 2020-04-02 05:36:04 | 501098384 |
| 17389 | raw | 17389 | catalog | 2020-04-02 05:36:05 | 501098384 |
| 17390 | raw | 17390 | main | 2020-04-02 05:36:40 | 501098384 |
| 17391 | raw | 17391 | catalog | 2020-04-02 05:36:41 | 501098384 |
This data processor can be helpful when you have data that chronologically
precedes the clickstream you are working with. For instance, your clickstream
might cover 1-month of user data, and also you have the user login data
for the whole year. In that case, you can use LabelNewUsers
to split users into two categories:
new users,
users who have appeared this year before.
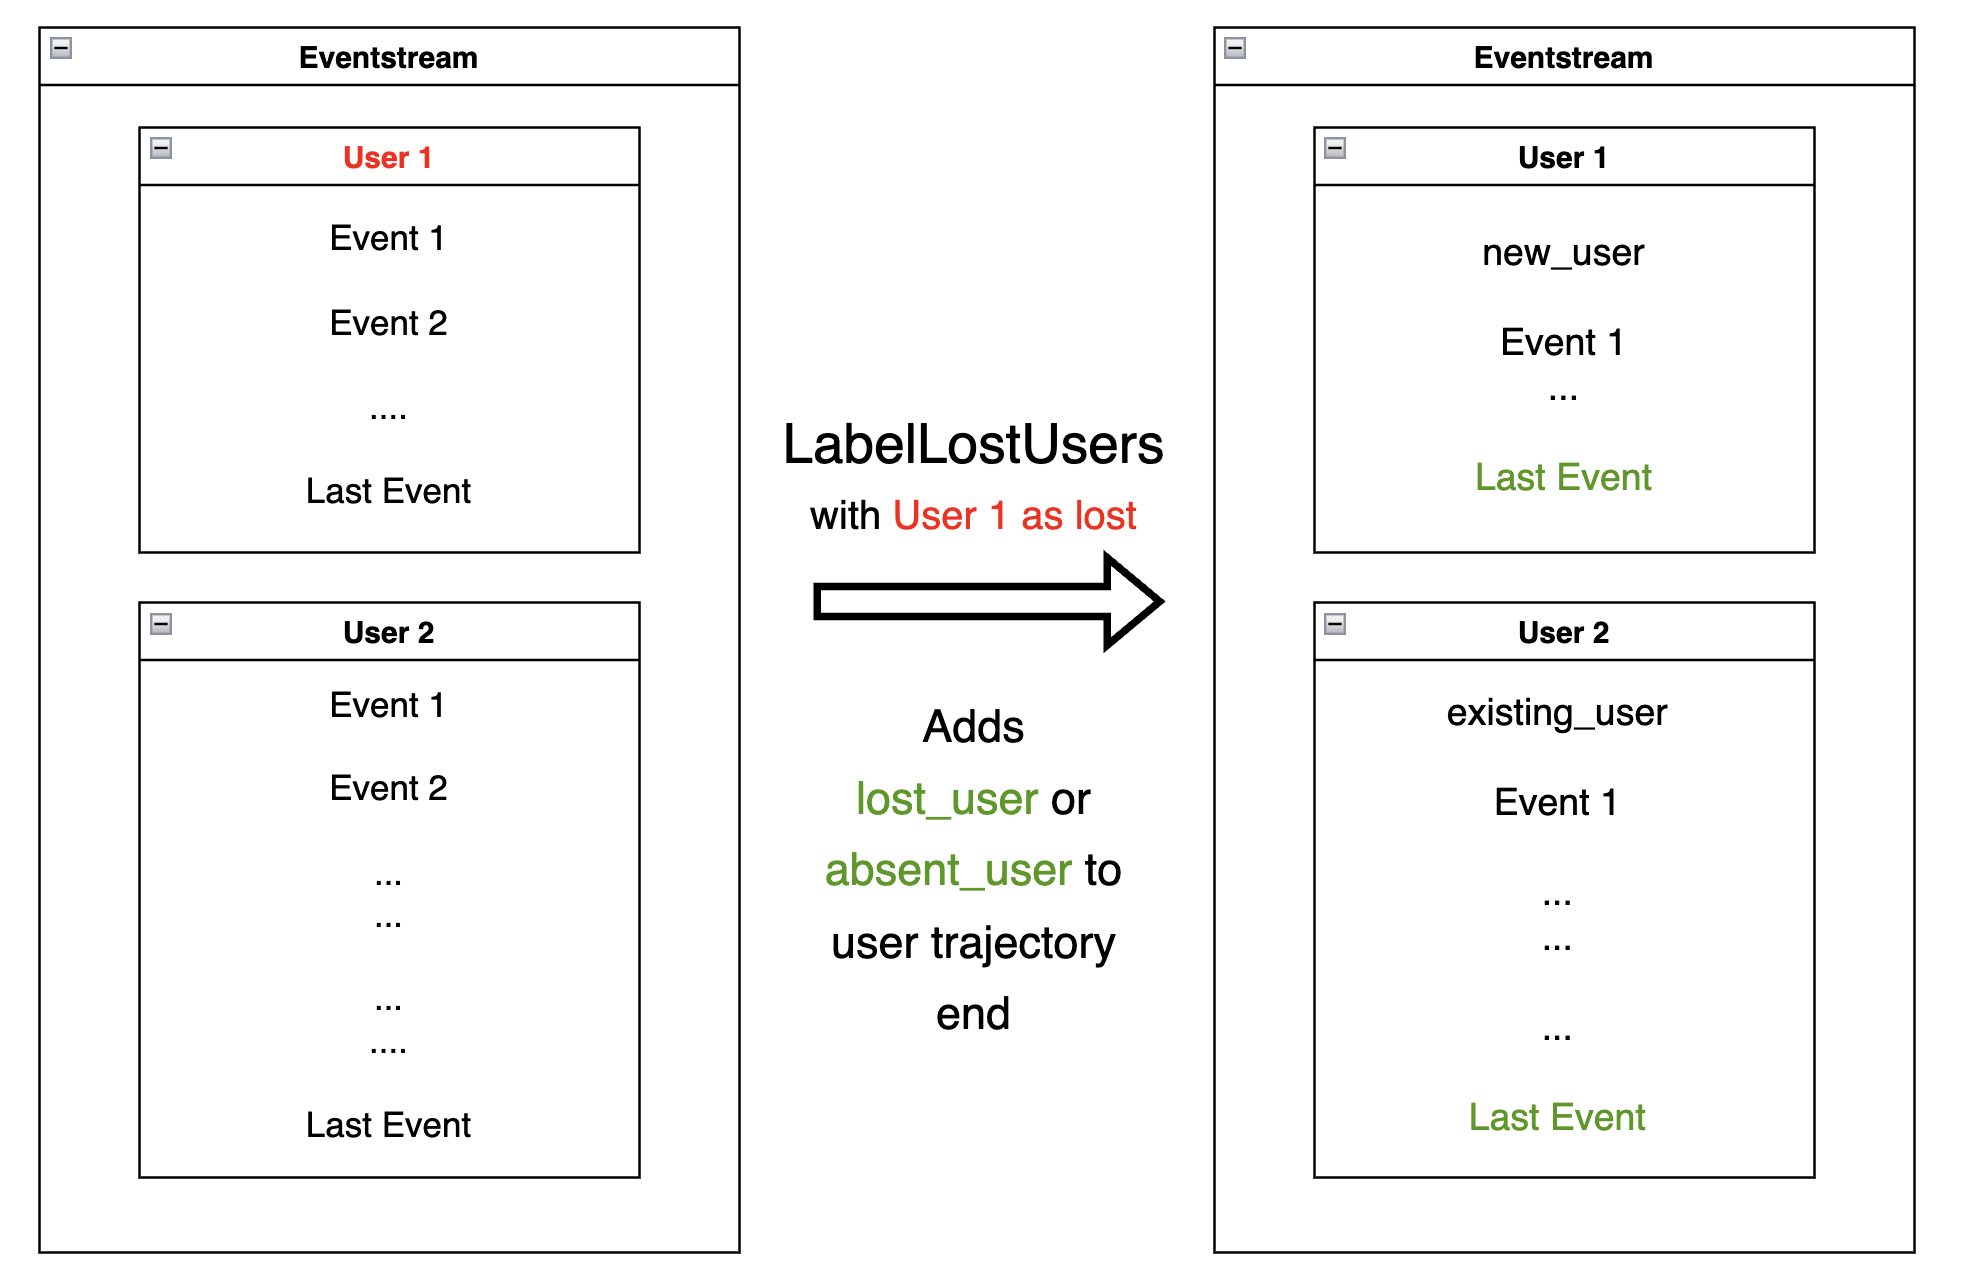
LabelLostUsers#
Given a list of users (considered “lost”), the
LabelLostUsers
data processor labels those users by adding a synthetic lost_user event to each
user trajectory end. For all other users, adds an
absent_user synthetic event. When passed a timeout timedelta value,
the method labels users based on the following strategy: if the
timedelta between the user last event and the eventstream last event
exceeds timeout, label as lost_user; otherwise, label as
absent_user.
lost_users_list = [219483890, 964964743, 965024600]
res = stream.label_lost_users(lost_users_list=lost_users_list).to_dataframe()
res[res['user_id'] == 219483890].tail()
| event_type | event_index | event | timestamp | user_id | |
|---|---|---|---|---|---|
| 5175 | raw | 5175 | catalog | 2020-01-06 22:11:28 | 219483890 |
| 9329 | raw | 9329 | main | 2020-02-14 21:04:49 | 219483890 |
| 9330 | raw | 9330 | catalog | 2020-02-14 21:04:51 | 219483890 |
| 9332 | lost_user | 9332 | lost_user | 2020-02-14 21:04:52 | 219483890 |
As opposed to user 219483890, the user 501098384 is labeled as an
absent_user.
res[res['user_id'] == 501098384].tail()
| event_type | event_index | event | timestamp | user_id | |
|---|---|---|---|---|---|
| 39127 | raw | 39127 | catalog | 2020-04-29 12:48:01 | 501098384 |
| 39128 | raw | 39128 | main | 2020-04-29 12:48:01 | 501098384 |
| 39129 | raw | 39129 | catalog | 2020-04-29 12:48:06 | 501098384 |
| 39130 | absent_user | 39130 | absent_user | 2020-04-29 12:48:06 | 501098384 |
The function of this data processor is similar to
LabelNewUsers, except that it adds labels to the end
of user trajectory.
We can also run LabelLostUsers with timeout passed, to
arbitrarily label some users as lost. Assume we consider a user
absent if there have been no events for 30 days:
res = stream.label_lost_users(timeout=(30, 'D')).to_dataframe()
Before we inspect the results of applying the data processor,
notice that the eventstream ends at 2020-04-29 12:48:07.
res['timestamp'].max()
Timestamp('2020-04-29 12:48:07.595390')
User 495985018 is labeled as lost since her last event occurred
on 2019-11-02. It’s more than 30 days before the end of the
eventstream.
res[res['user_id'] == 495985018]
| event_type | event_index | event | timestamp | user_id | |
|---|---|---|---|---|---|
| 47 | raw | 47 | catalog | 2019-11-02 01:14:08 | 495985018 |
| 48 | raw | 48 | cart | 2019-11-02 01:14:37 | 495985018 |
| 49 | lost_user | 49 | lost_user | 2019-11-02 01:14:37 | 495985018 |
On the other hand, user 819489198 is labeled absent because
her last event occurred on 2020-04-15, less than 30 days
before 2020-04-29.
res[res['user_id'] == 819489198]
| event_type | event_index | event | timestamp | user_id | |
|---|---|---|---|---|---|
| 26529 | raw | 26529 | main | 2020-04-15 21:02:36 | 819489198 |
| ... | ... | ... | ... | ... | ... |
| 26544 | raw | 26544 | payment_card | 2020-04-15 21:03:46 | 819489198 |
| 26545 | raw | 26545 | payment_done | 2020-04-15 21:03:47 | 819489198 |
| 26546 | absent_user | 26546 | absent_user | 2020-04-15 21:03:47 | 819489198 |
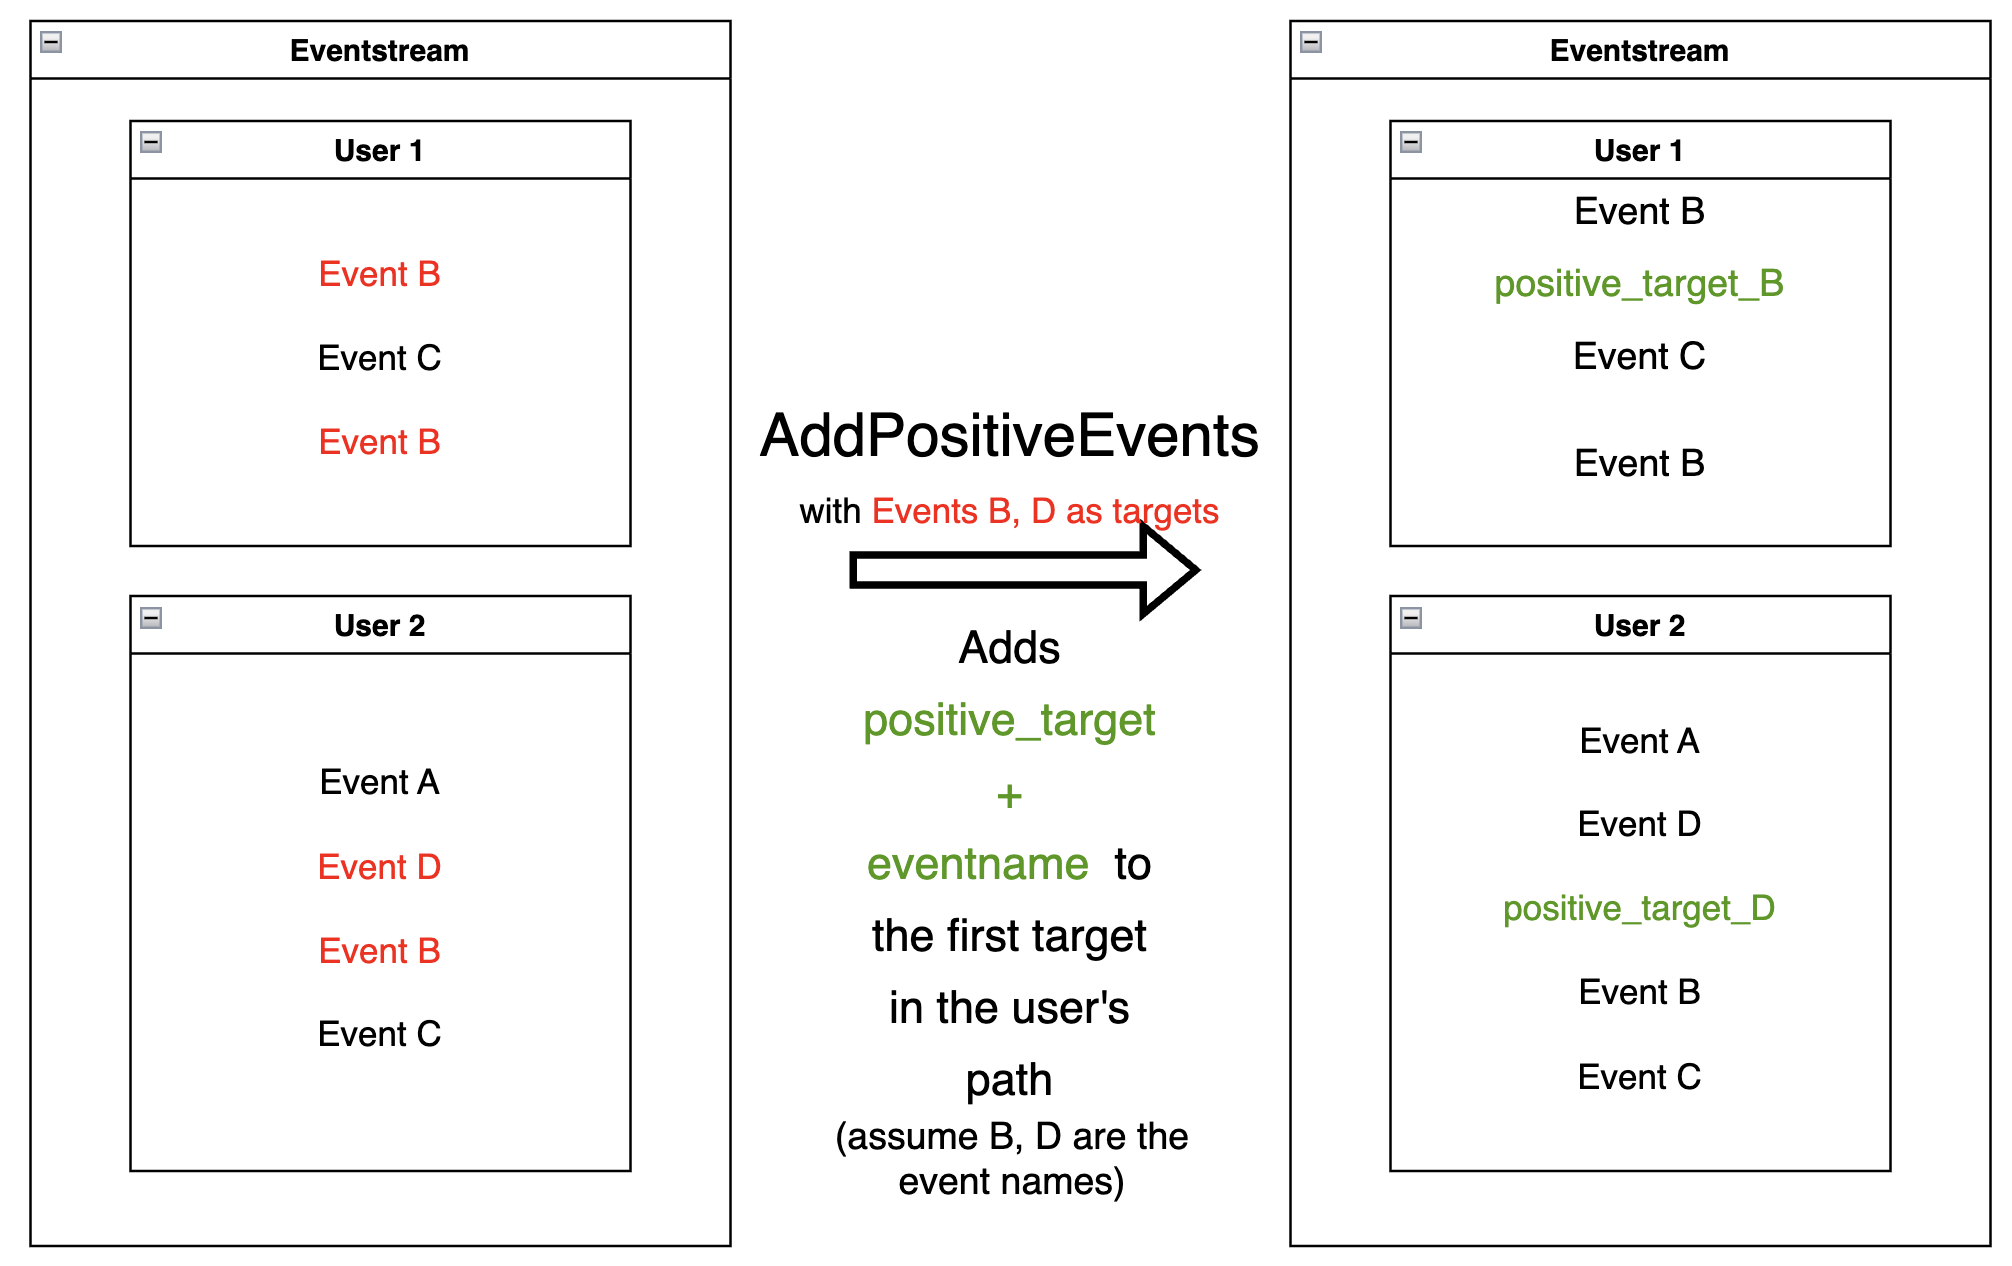
AddPositiveEvents#
AddPositiveEvents
data processor supports two parameters:
targets- list of “positive” events (for instance, associated with some conversion goal of the user behavior)func- this function accepts parentEventstreamas an argument and returnspandas.DataFramecontains only the lines of the events we would like to label as positive.
By default, for each user trajectory, an event from the
specified list (and minimum timestamp) is taken and cloned with
positive_target_<EVENTNAME> as the event and positive_target
type.
positive_events = ['cart', 'payment_done']
res = stream.add_positive_events(
    targets=positive_events
    ).to_dataframe()
Consider user 219483890, whose cart event appeared in her
trajectory with event_index=2. A synthetic event
positive_target_cart is added right after it.
res[res['user_id'] == 219483890]
| event_type | event_index | event | timestamp | user_id | |
|---|---|---|---|---|---|
| 0 | raw | 0 | catalog | 2019-11-01 17:59:13 | 219483890 |
| 1 | raw | 1 | product1 | 2019-11-01 17:59:28 | 219483890 |
| 2 | raw | 2 | cart | 2019-11-01 17:59:29 | 219483890 |
| 3 | positive_target | 3 | positive_target_cart | 2019-11-01 17:59:29 | 219483890 |
| ... | ... | ... | ... | ... | ... |
| 5116 | raw | 5116 | cart | 2020-01-06 22:10:42 | 219483890 |
| 5117 | raw | 5117 | catalog | 2020-01-06 22:10:52 | 219483890 |
| ... | ... | ... | ... | ... | ... |
| 9187 | raw | 9187 | catalog | 2020-02-14 21:04:51 | 219483890 |
In opposite to this user, user 24427596 has no positive events, so
her path remains unchanged:
res[res['user_id'] == 24427596]
| event_type | event_index | event | timestamp | user_id | |
|---|---|---|---|---|---|
| 68 | raw | 68 | main | 2019-11-02 07:28:07 | 24427596 |
| 69 | raw | 69 | catalog | 2019-11-02 07:28:14 | 24427596 |
| ... | ... | ... | ... | ... | ... |
| 71 | raw | 71 | catalog | 2019-11-02 07:29:42 | 24427596 |
This data processor can make it easier to label events that we would
like to consider as positive. It might be helpful for further analysis
with tools like TransitionGraph, StepMatrix, and
SankeyStep - as it will help to highlight the positive events.
Another way to set positive events is to pass a custom function in func.
For example, assume we need to label each target in a trajectory, not just the
first one:
def custom_func(eventstream, targets) -> pd.DataFrame:

    event_col = eventstream.schema.event_name
    df = eventstream.to_dataframe()

    return df[df[event_col].isin(targets)]

res = stream.add_positive_events(
          targets=positive_events,
          func=custom_func
          ).to_dataframe()
res[res['user_id'] == 219483890]
| event_type | event_index | event | timestamp | user_id | |
|---|---|---|---|---|---|
| 0 | raw | 0 | catalog | 2019-11-01 17:59:13 | 219483890 |
| 1 | raw | 1 | product1 | 2019-11-01 17:59:28 | 219483890 |
| 2 | raw | 2 | cart | 2019-11-01 17:59:29 | 219483890 |
| 3 | positive_target | 3 | positive_target_cart | 2019-11-01 17:59:29 | 219483890 |
| ... | ... | ... | ... | ... | ... |
| 5116 | raw | 5116 | cart | 2020-01-06 22:10:42 | 219483890 |
| 5117 | positive_target | 5117 | positive_target_cart | 2020-01-06 22:10:42 | 219483890 |
| 5118 | raw | 5118 | catalog | 2020-01-06 22:10:52 | 219483890 |
| ... | ... | ... | ... | ... | ... |
| 9188 | raw | 9188 | catalog | 2020-02-14 21:04:51 | 219483890 |
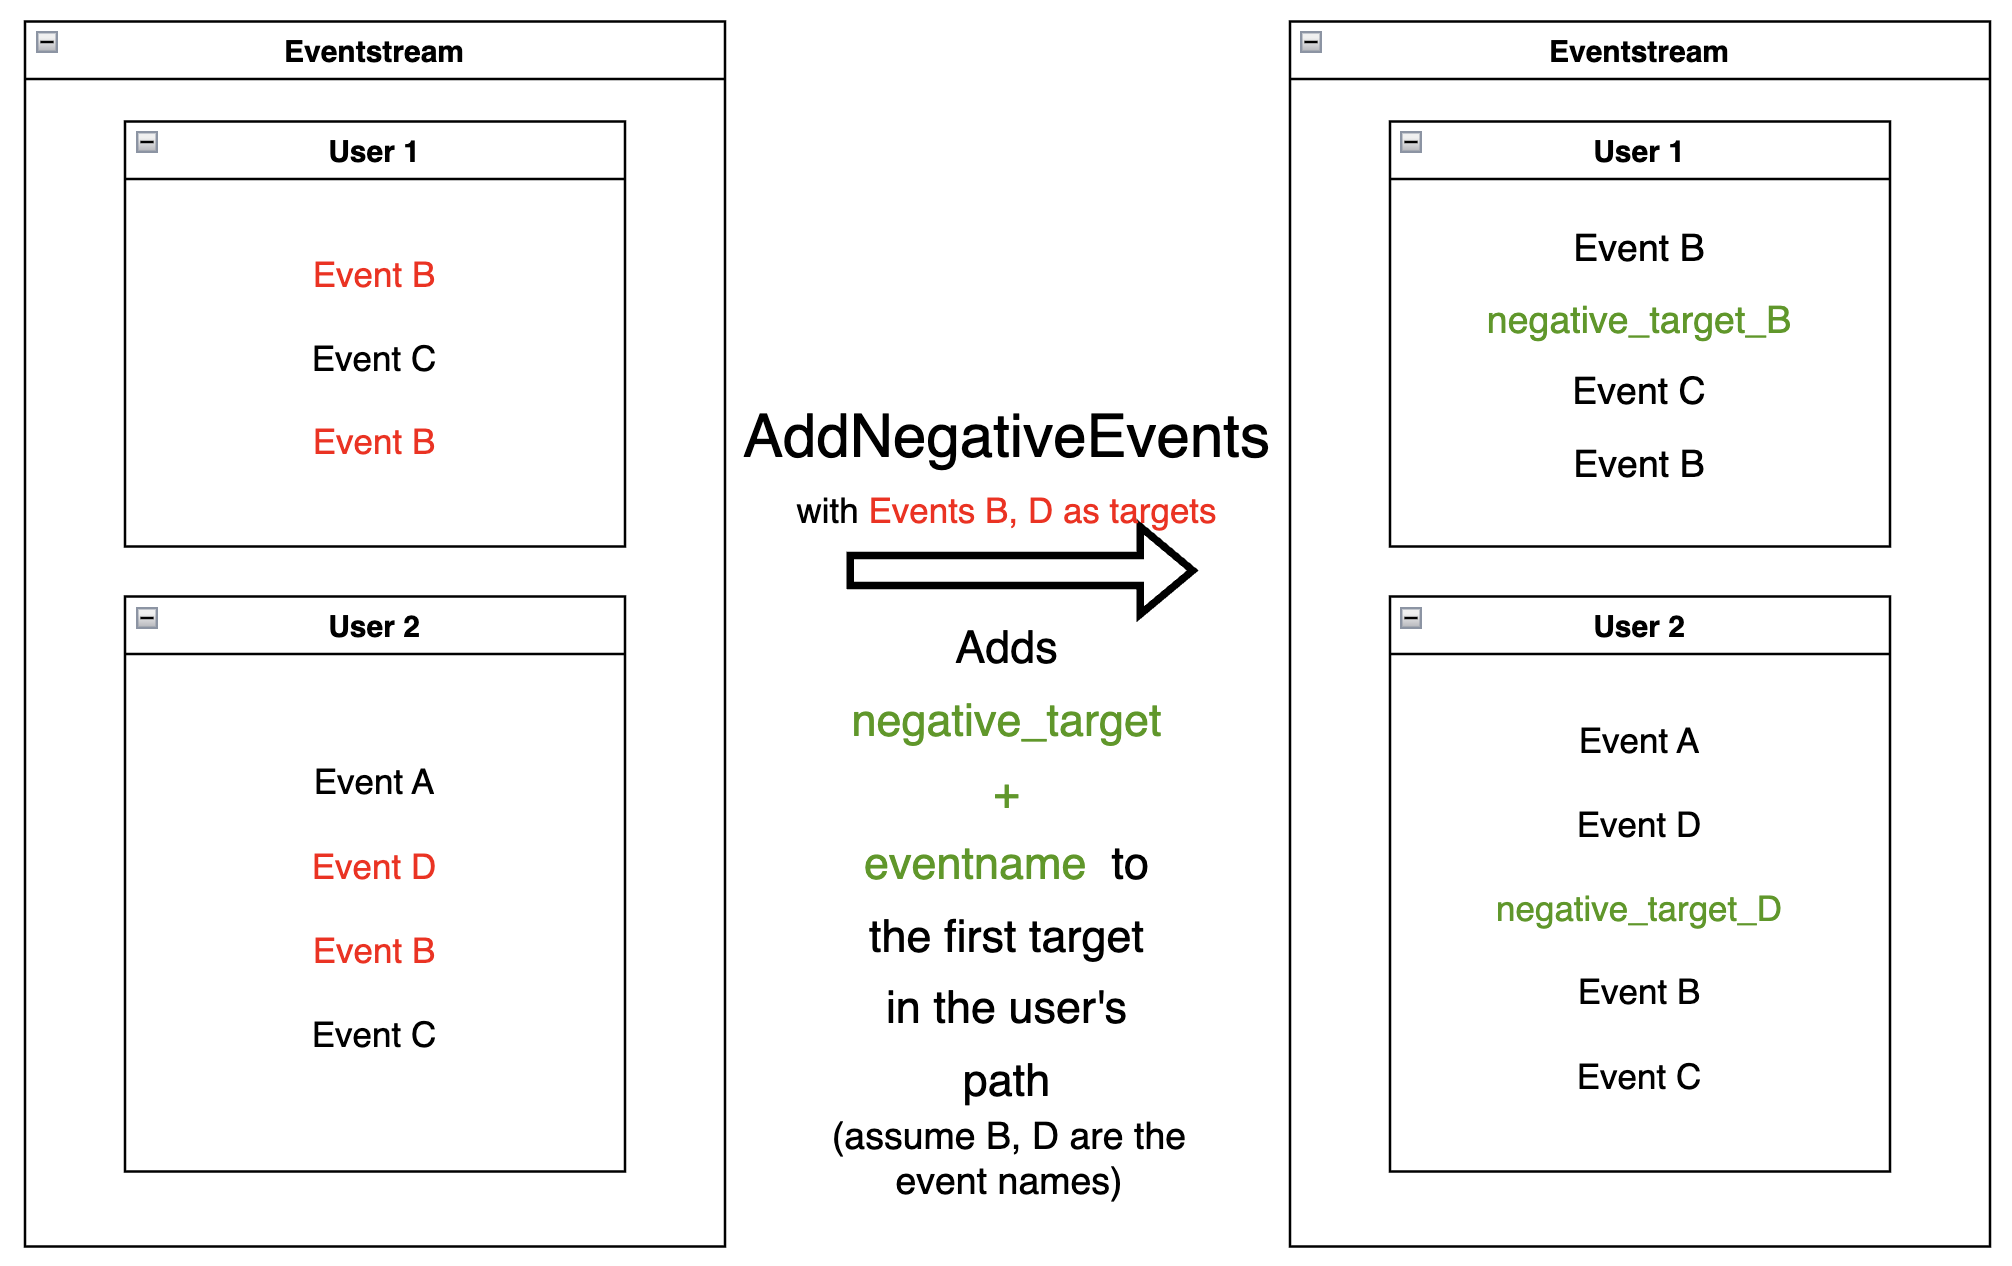
AddNegativeEvents#
The idea of
AddNegativeEvents
data processor is the same as AddPositiveEvents, but
applied to negative labels instead of positive ones.
targets- list of “positive”events(for instance, associated with some negative result of the user behavior)
func- this function accepts parentEventstreamas an argument and returnspandas.DataFrame, which contains only the lines of the events we would like to label as negative.
negative_events = ['delivery_courier']

res = stream.add_negative_events(
          targets=negative_events
          ).to_dataframe()
Works similarly to the AddPositiveEvents data processor - in this
case, it will add negative event next to the delivery_courier event:
res[res['user_id'] == 629881394]
| event_type | event_index | event | timestamp | user_id | |
|---|---|---|---|---|---|
| 7 | raw | 7 | main | 2019-11-01 22:28:54 | 629881394 |
| ... | ... | ... | ... | ... | ... |
| 39 | raw | 39 | delivery_courier | 2019-11-01 22:36:02 | 629881394 |
| 41 | negative_target | 41 | negative_target_delivery_courier | 2019-11-01 22:36:02 | 629881394 |
| 44 | raw | 44 | payment_choice | 2019-11-01 22:36:02 | 629881394 |
| ... | ... | .. | ... | ... | ... |
| 13724 | raw | 13724 | catalog | 2020-03-30 03:19:59 | 629881394 |
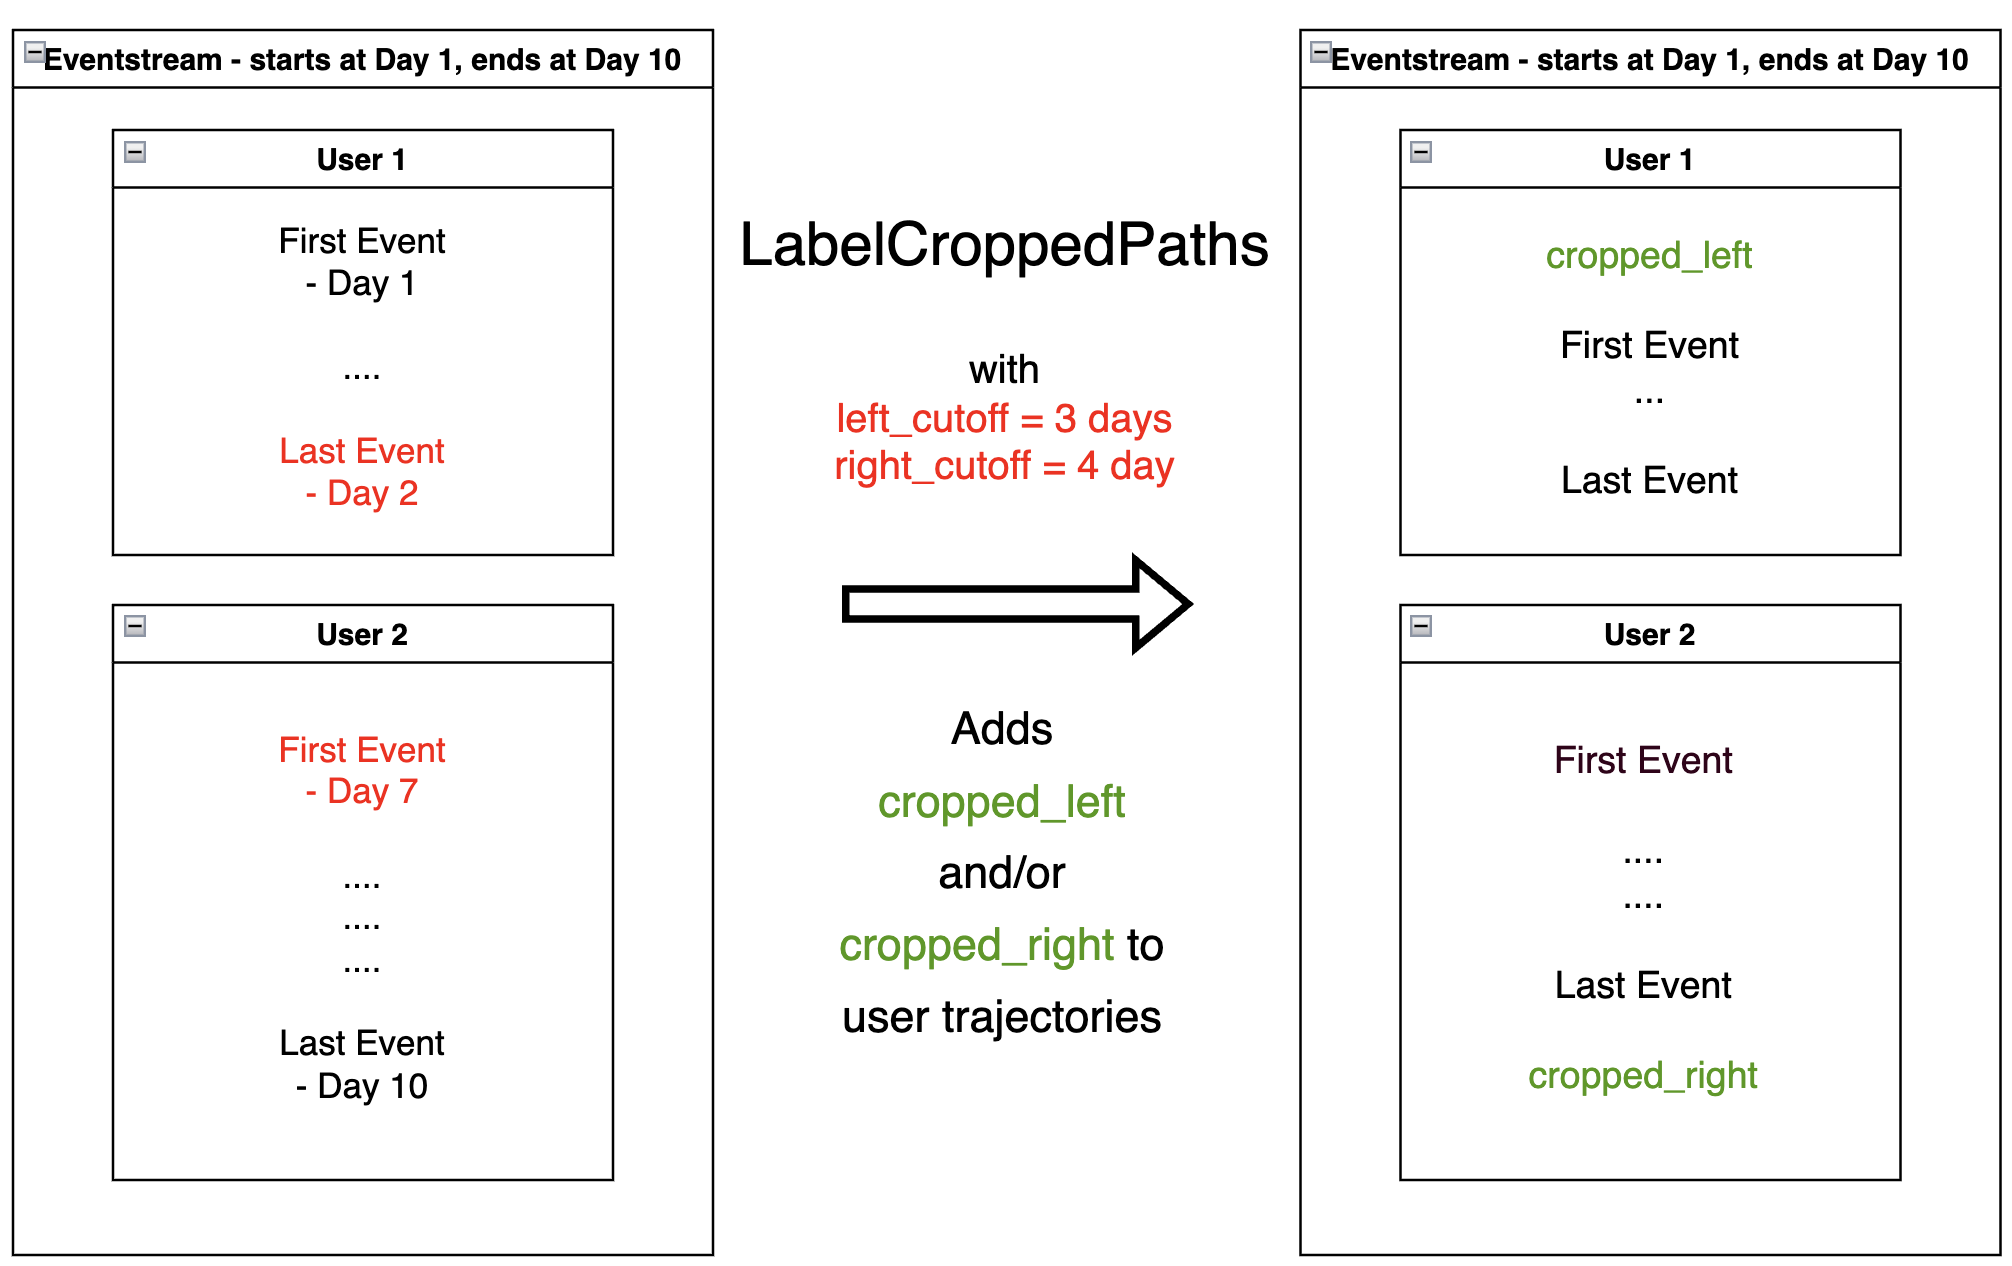
LabelCroppedPaths#
LabelCroppedPaths
addresses a common practical problem, when some trajectories are
truncated due to the dataset’s natural boundaries.
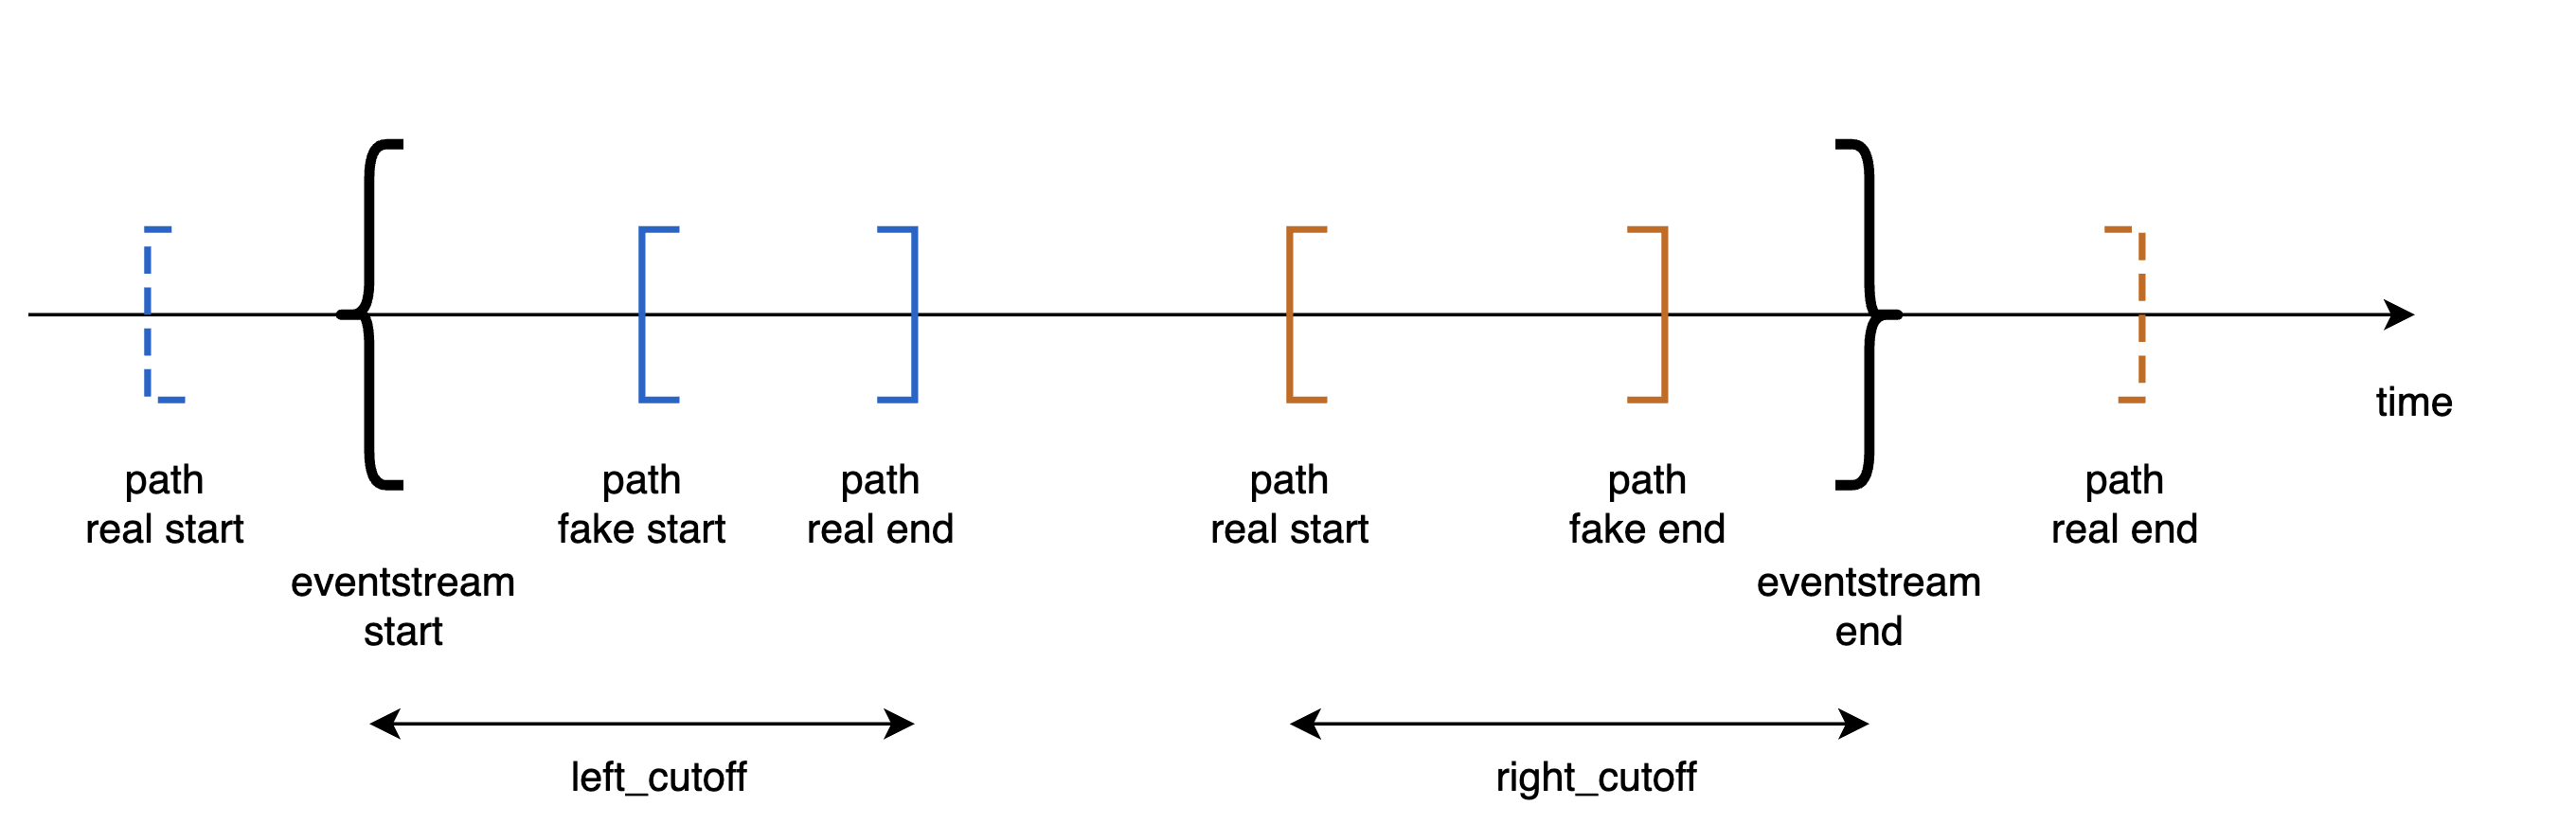
The diagram above illustrates this problem. Consider two user paths – blue and orange. In reality, the blue path started before the beginning of the eventstream. But we cannot observe that - since we haven’t access to the events to the left from the beginning of the eventstream. So, instead of the actual start of the user path, we observe a “false” beginning, and the observed trajectory is truncated.
A similar situation occurs with the orange user path. Instead of the actual trajectory end, we only observe the “false” trajectory end.
One possible way to mark truncated paths is to detect trajectories that are “too short” for a typical trajectory, and whose shortness can be attributed to being truncated.
LabelCroppedPaths data processor uses passed left_cutoff and
right_cutoff timedeltas and labels user trajectories as
cropped_left or cropped_right based on the following
policy:
if the last event of a user trajectory is distanced from the first event of the whole eventstream by less than
left_cutoff, consider the user trajectory truncated from the left, and createcropped_leftsynthetic event at the trajectory start;if the first event of a user trajectory is distanced from the last event of the whole eventstream by less than
right_cutoff, consider the user trajectory truncated from the right, and createcropped_rightsynthetic event at the trajectory end.
Sometimes, it can be a good practice to use different cutoff values and compare them in some fashion to select the best.
It can be helpful to use
TimedeltaHist method
with specified event_pair=('eventstream_start', 'path_end') for choosing left_cutoff
value and event_pair=('path_start', 'eventstream_end') for choosing right_cutoff.
See more about eventstream descriptive methods.
params = {
    'left_cutoff': (4, 'D'),
    'right_cutoff': (3, 'D')
}

res = stream.label_cropped_paths(**params).to_dataframe()
Displaying the eventstream start and end timestamps:
print('Eventstream start: {}'.format(res.timestamp.min()))
print('Eventstream end: {}'.format(res.timestamp.max()))
Eventstream start: 2019-11-01 17:59:13.273932
Eventstream end: 2020-04-29 12:48:07.595390
The trajectory of the following user ends at 2019-11-02 01:14:38 - which is too
close to the eventstream start(for the given left_cutoff
value), so the LabelCroppedPaths data processor labels it as truncated
from the left:
res[res['user_id'] == 495985018]
| event_type | event_index | event | timestamp | user_id | |
|---|---|---|---|---|---|
| 47 | cropped_left | 47 | cropped_left | 2019-11-02 01:14:08 | 495985018 |
| 48 | raw | 48 | catalog | 2019-11-02 01:14:08 | 495985018 |
| 49 | raw | 49 | cart | 2019-11-02 01:14:37 | 495985018 |
The trajectory of the following user starts at 2020-04-29 12:24:21 - which is too
close to the eventstream end(for the given right_cutoff
value), so
the LabelCroppedPaths data processor labels it as truncated from the
right:
res[res['user_id'] == 831491833]
| event_type | event_index | event | timestamp | user_id | |
|---|---|---|---|---|---|
| 35627 | raw | 35627 | catalog | 2020-04-29 12:24:21 | 831491833 |
| 35628 | raw | 35628 | catalog | 2020-04-29 12:24:33 | 831491833 |
| 35629 | raw | 35629 | product2 | 2020-04-29 12:24:39 | 831491833 |
| 35630 | raw | 35630 | cart | 2020-04-29 12:24:59 | 831491833 |
| 35631 | raw | 35631 | catalog | 2020-04-29 12:25:06 | 831491833 |
| 35632 | cropped_right | 35632 | cropped_right | 2020-04-29 12:25:06 | 831491833 |
Removing processors#
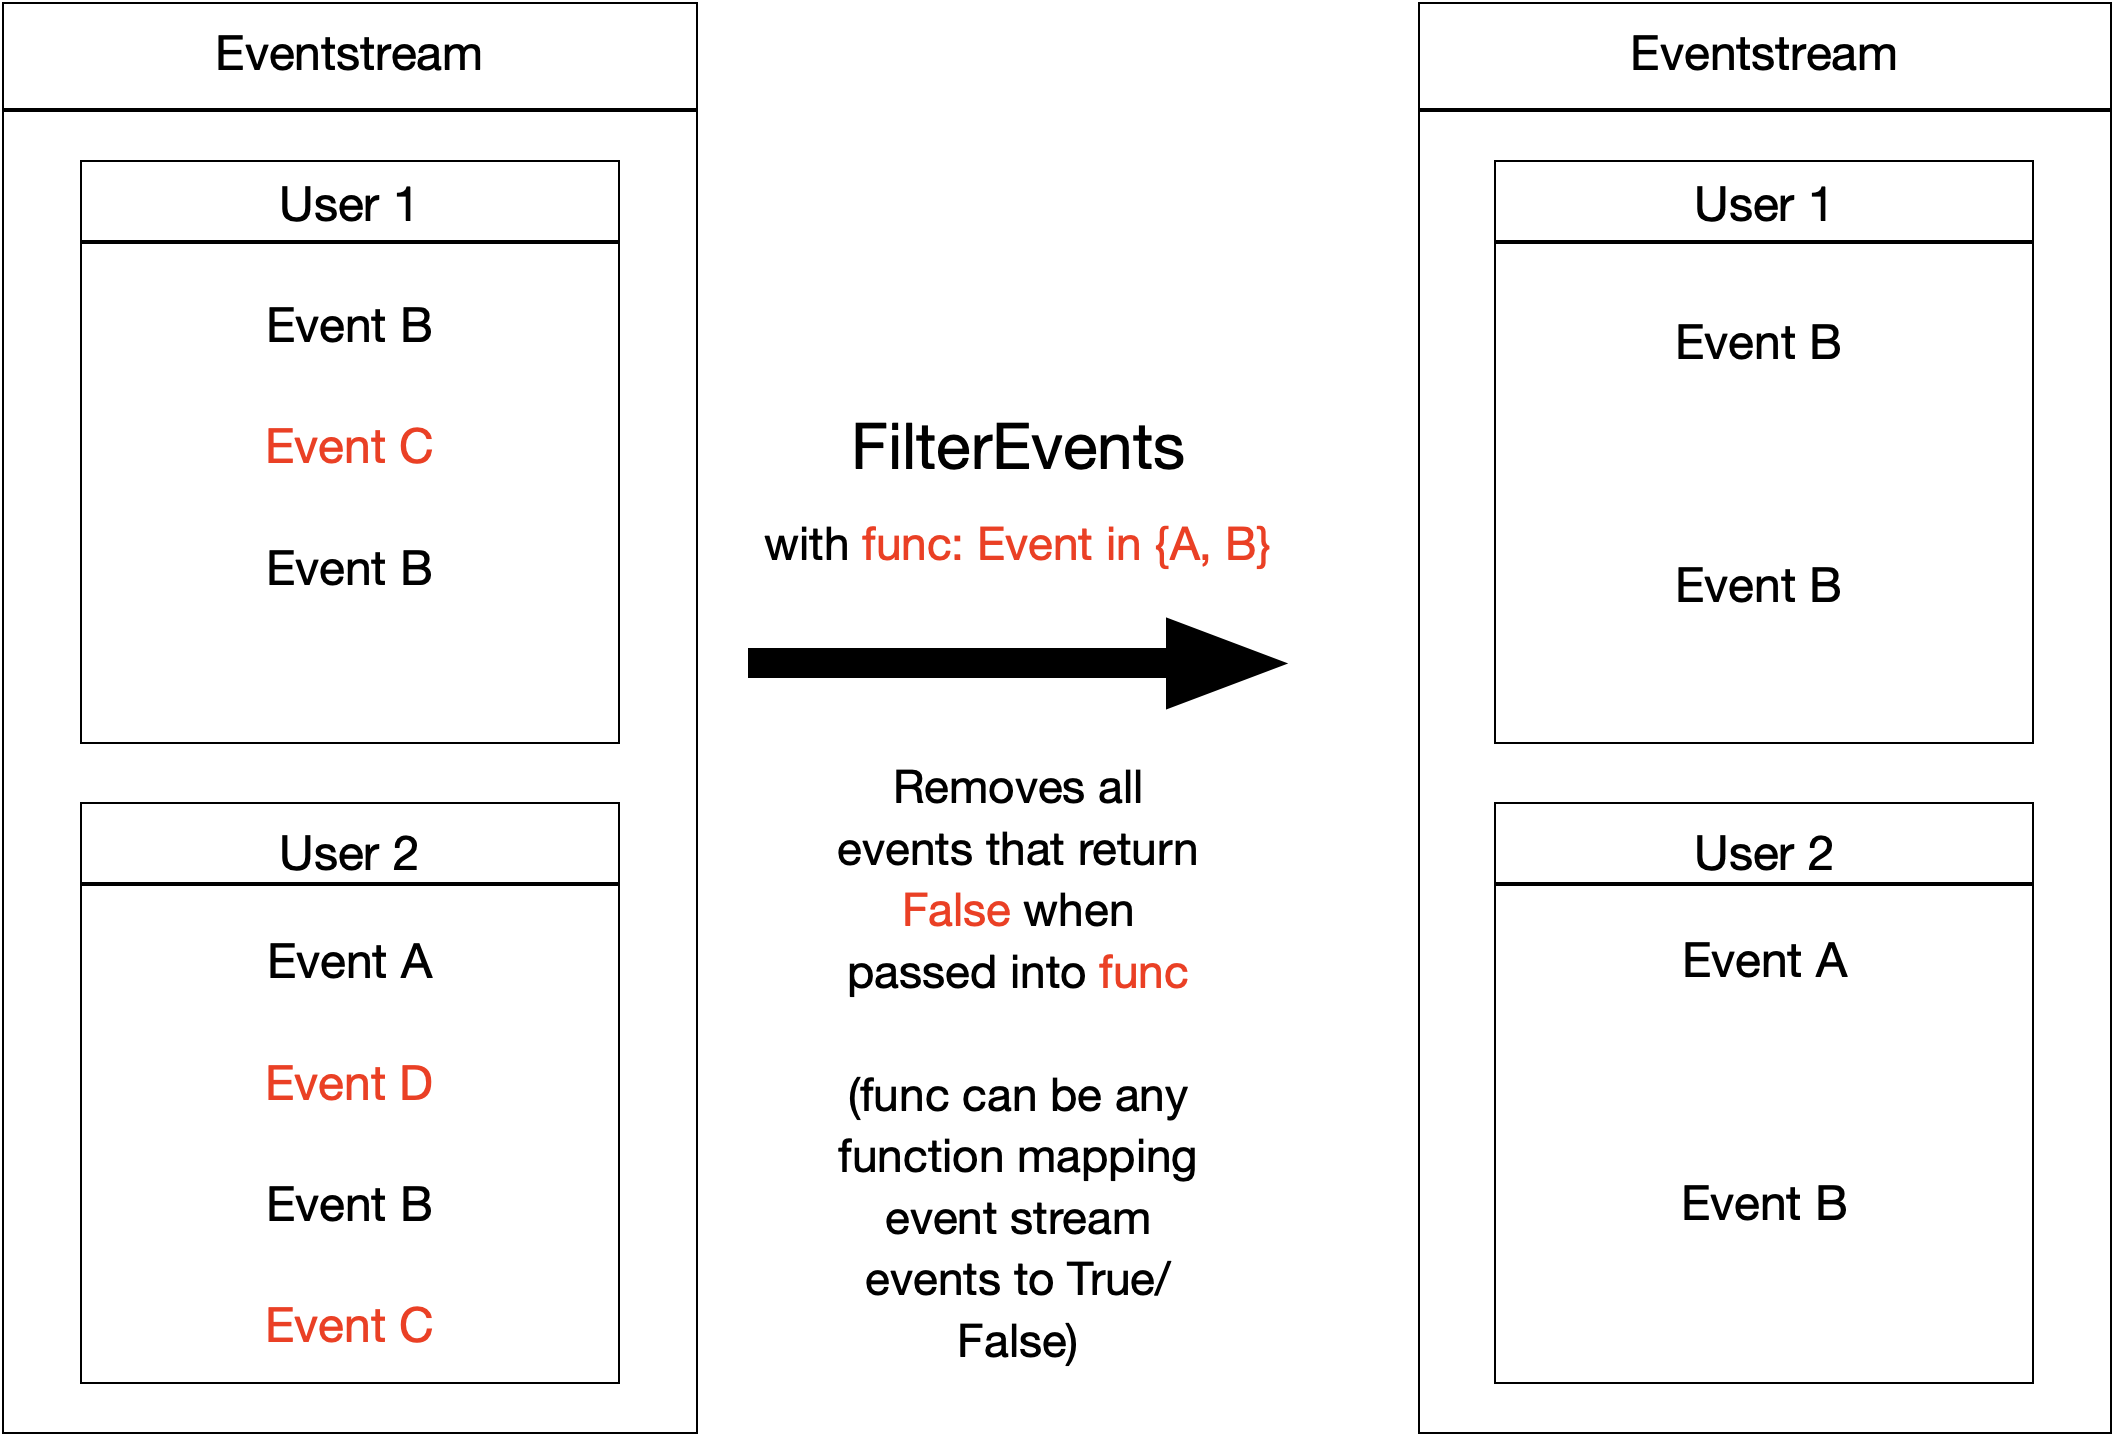
FilterEvents#
FilterEvents
keeps events based on the masking function func.
The function should return a boolean mask for the input dataframe(a series
of boolean True or False variables that filter the DataFrame underlying
the eventstream).
Let us say we are interested only in specific events - for example, only
in events of users that appear in some pre-defined list of users.
FilterEvents allows us to access only those events:
def save_specific_users(df, schema):
    users_to_save = [219483890, 964964743, 965024600]
    return df[schema.user_id].isin(users_to_save)

res = stream.filter_events(func=save_specific_users).to_dataframe()
The resulting eventstream includes these three users only:
res['user_id'].unique().astype(int)
array([219483890, 964964743, 965024600])
Note that the masking function accepts schema optional argument.
Having this parameter defined, you can access any eventstream column,
defined in its
EventstreamSchema.
However, you could also access user_id directly with df['user_id'] calling.
This makes such masking functions reusable regardless of eventstream column titles.
Using FilterEvents data processor, we can
also remove specific events from the eventstream. Let us remove all
catalog and main events, assuming they are non-informative for
us:
stream.to_dataframe()\
    ['event']\
    .value_counts()\
    [lambda s: s.index.isin(['catalog', 'main'])]
catalog    14518
main        5635
Name: event, dtype: int64
def exclude_events(df, schema):
    events_to_exclude = ['catalog', 'main']
    return ~df[schema.event_name].isin(events_to_exclude)

res = stream.filter_events(func=exclude_events).to_dataframe()
We can see that res DataFrame does not have “useless” events anymore.
res['event']\
    .value_counts()\
    [lambda s: s.index.isin(['catalog', 'main'])]
Series([], Name: event, dtype: int64)
DropPaths#
DropPaths
removes the paths which we consider “too short”. We might
be interested in excluding such paths - in case they are too short to
be informative for our task.
Path length can be specified in the following ways:
setting the number of events comprising a path,
setting the time distance between the beginning and the end of the path.
The former is associated with min_steps parameter, the latter –
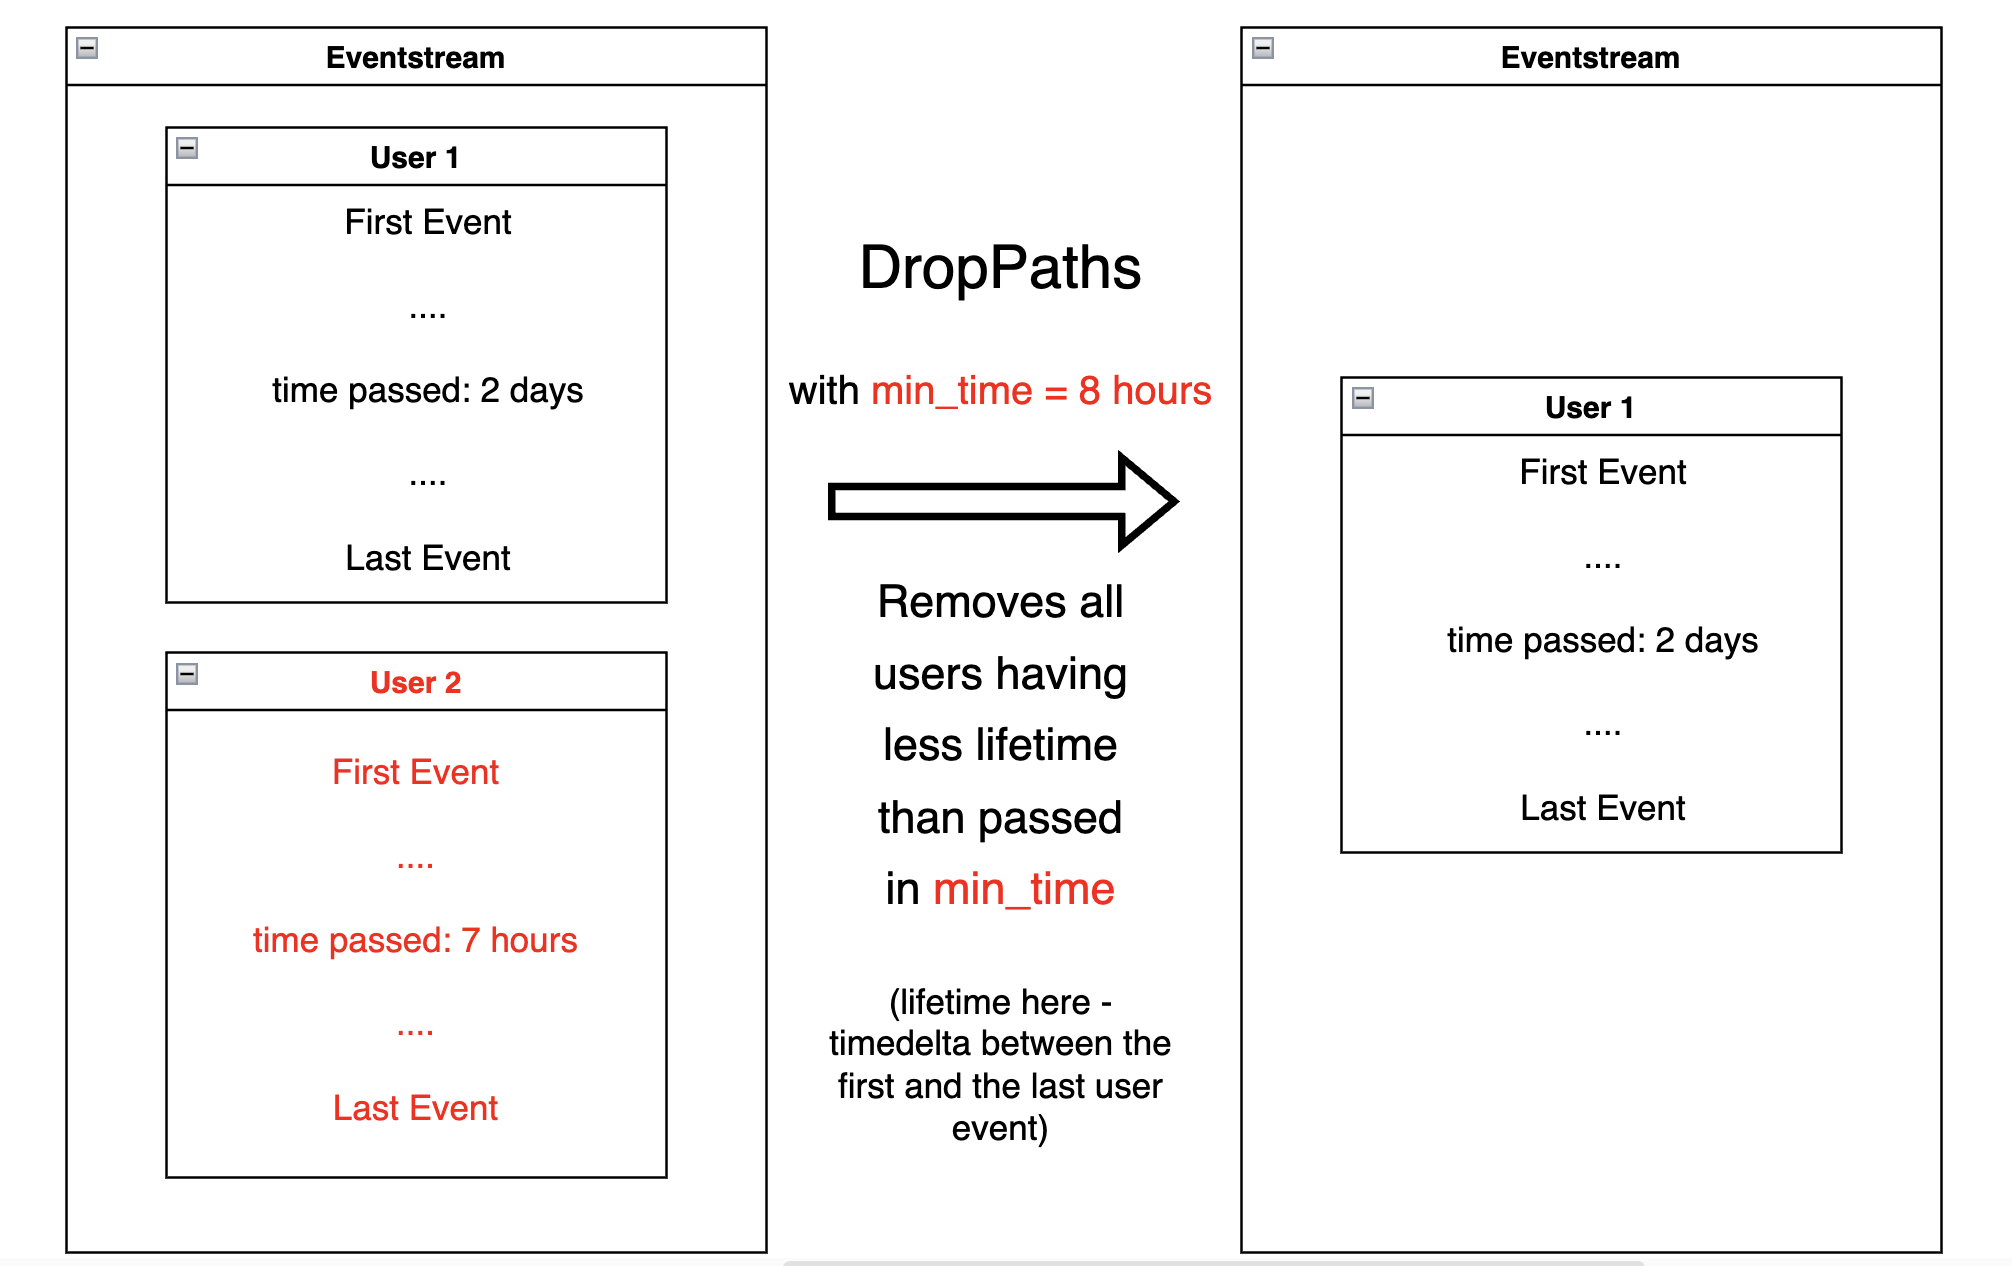
with min_time parameter. Thus, DropPaths removes all
the paths of length less than min_steps or min_time.
Diagram for specified min_steps:
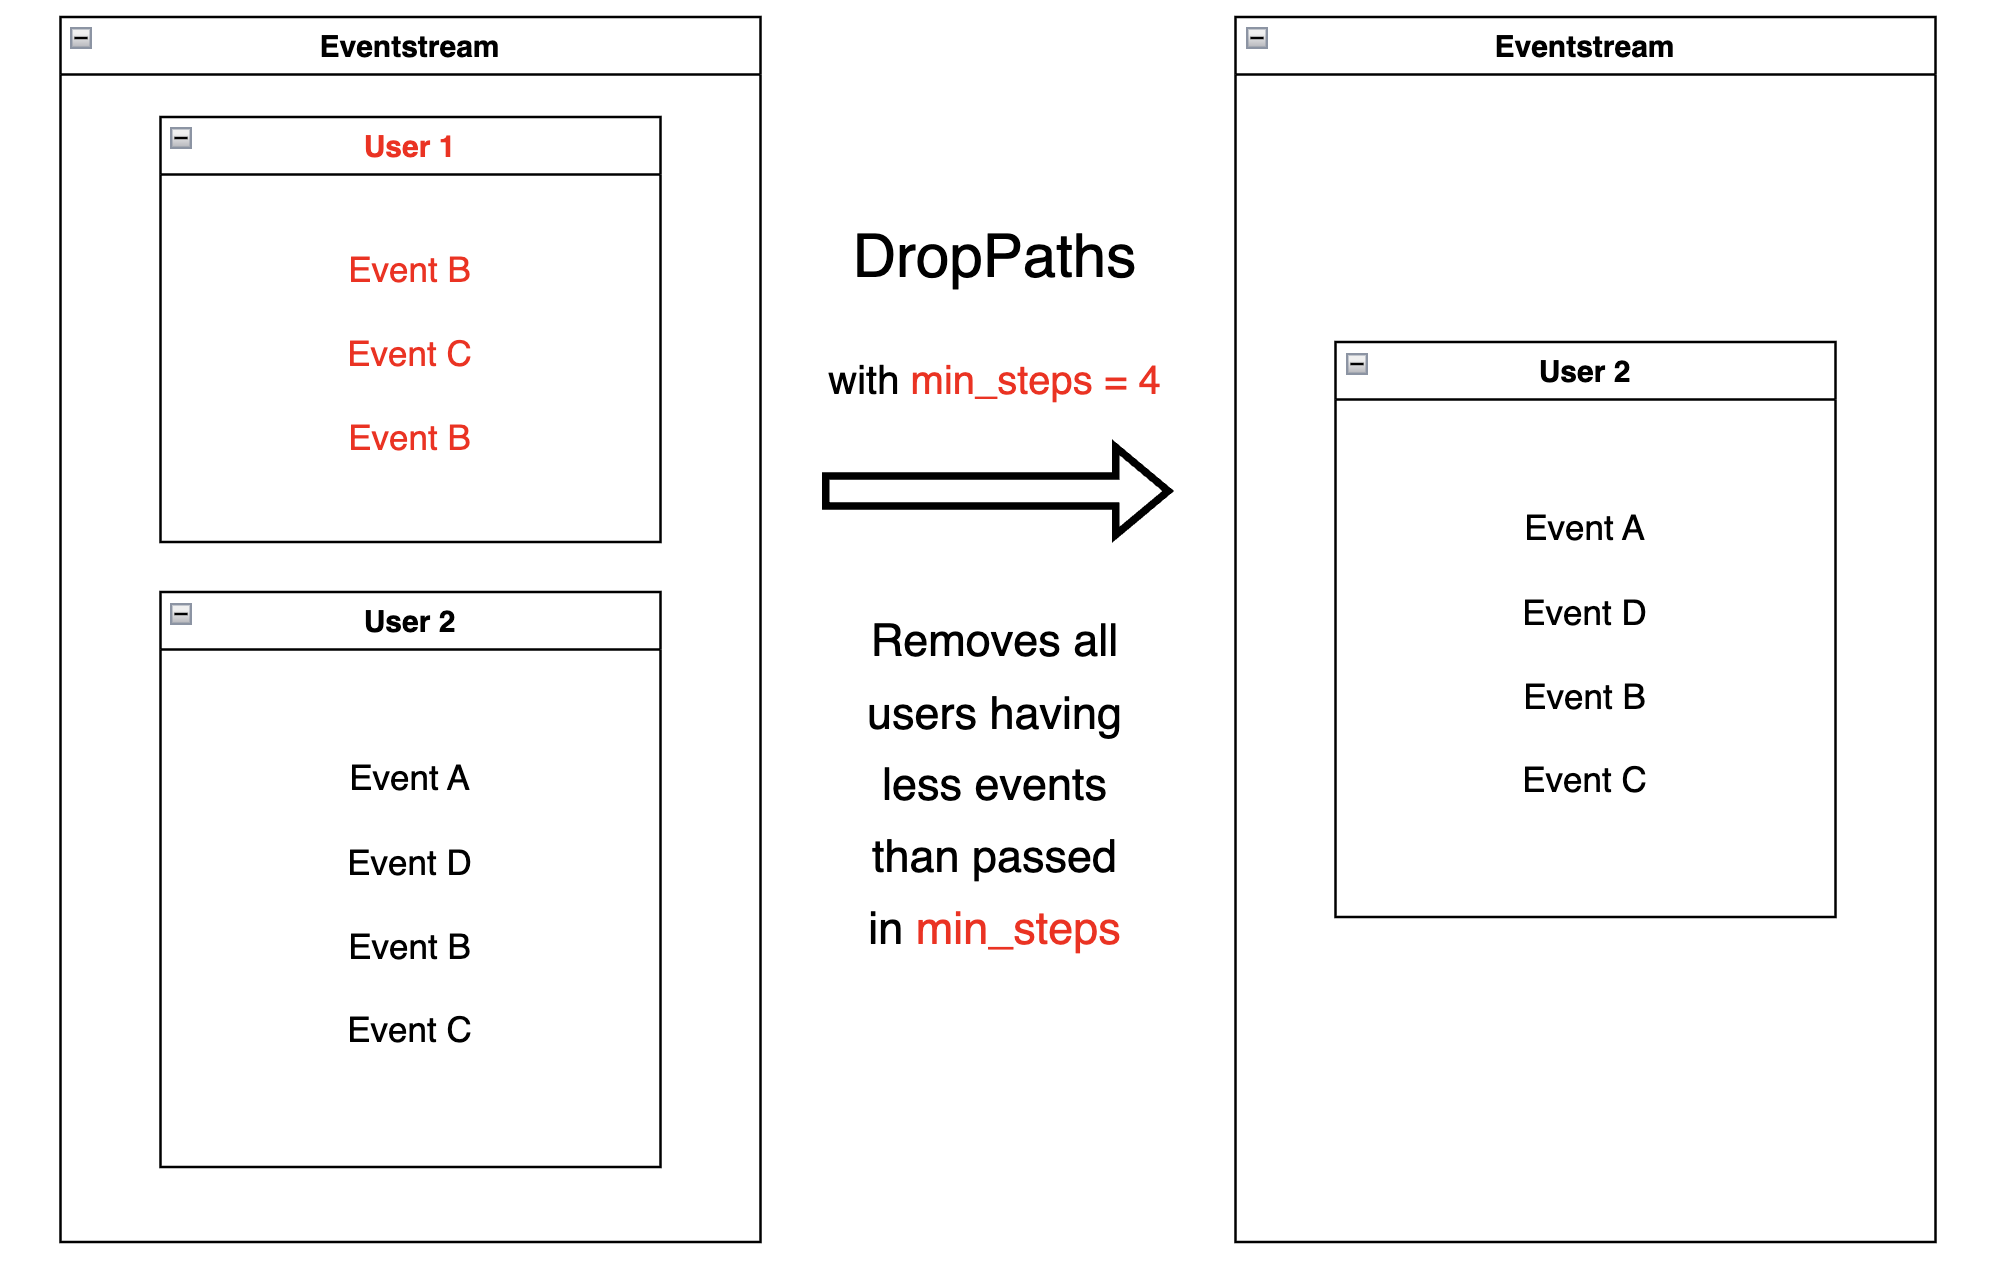
Diagram for specified min_time:
Let us showcase both variants of the DropPaths
data processor:
A minimum number of events specified:
res = stream.drop_paths(min_steps=25).to_dataframe()
Any remaining user has at least 25 events. For example, user
629881394 has 48 events.
len(res[res['user_id'] == 629881394])
48
A minimum path length (user lifetime) is specified:
res = stream.drop_paths(min_time=(1, 'M')).to_dataframe()
Any remaining user has been “alive” for at least a month. For
example, user 964964743 started her trajectory on 2019-11-01 and
ended on 2019-12-09.
res[res['user_id'] == 964964743].iloc[[0, -1]]
| event_type | event_index | event | timestamp | user_id | |
|---|---|---|---|---|---|
| 4 | raw | 4 | catalog | 2019-11-01 21:38:19 | 964964743 |
| 3457 | raw | 3457 | delivery_pickup | 2019-12-09 01:43:57 | 964964743 |
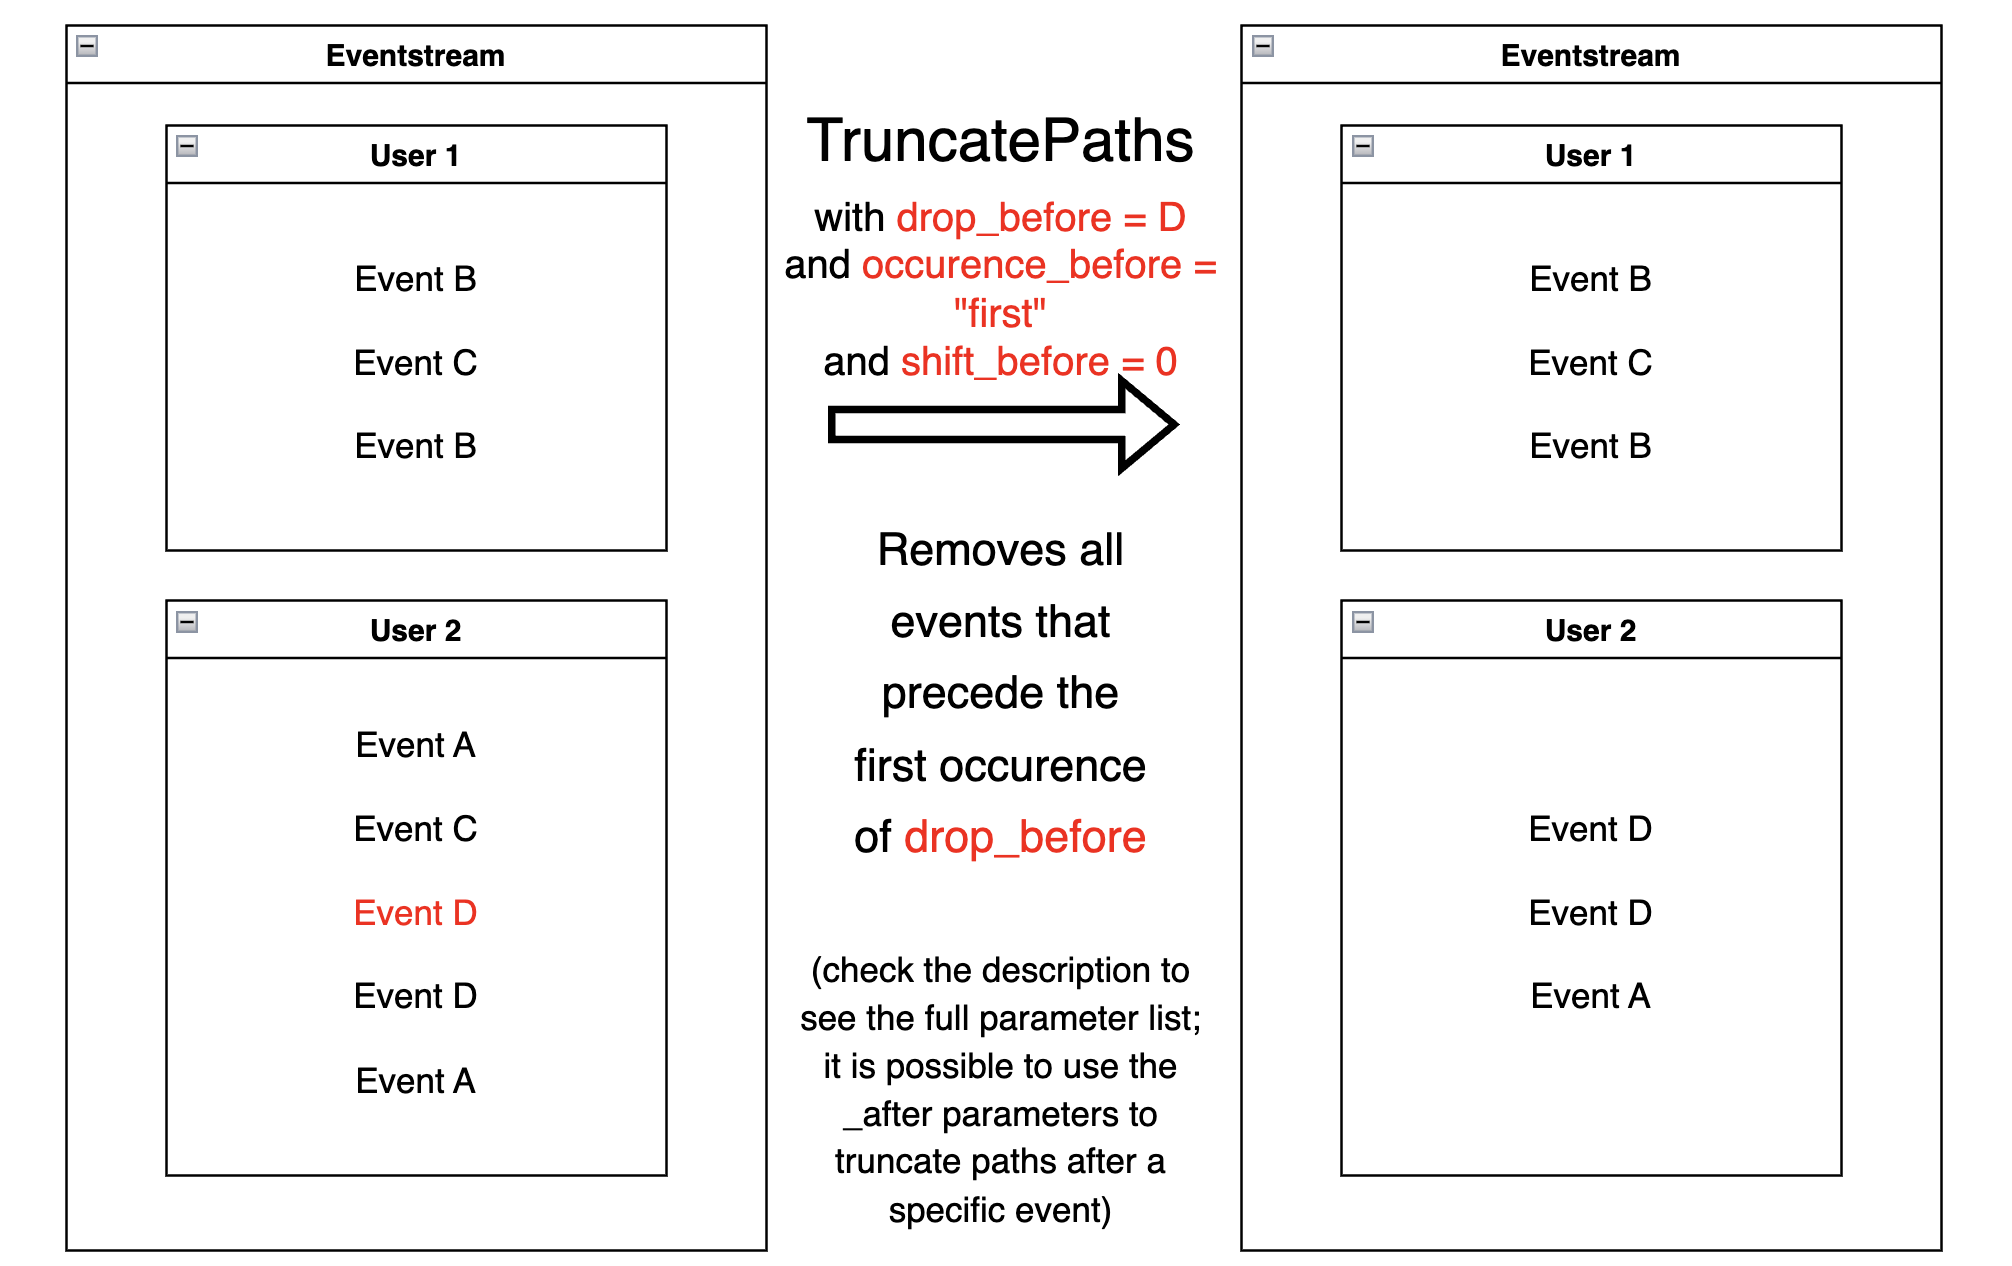
TruncatePaths#
For each user trajectory, TruncatePaths
drops all events before or after a particular event.
The following parameters specify the behavior:
drop_before: event name before which part of the user’s path is dropped. The specified event remains in the eventstream.drop_after: event name after which part of the user’s path is dropped. The specified event remains in the eventstream.occurrence_before: if set tofirst(by default), all events before the first occurrence of thedrop_beforeevent are dropped. If set tolast, all events before the last occurrence of thedrop_beforeevent are dropped.occurrence_after: the same behavior as in theoccurrence_before, but for right (after the event) path truncation.shift_before: sets the number of steps by which the truncate point is shifted from the selected event. If the value is negative, the offset occurs to the left along the timeline; if positive, then the offset occurs to the right.shift_after: the same behavior as in the shift_before, but for right (after the event) path truncation.
The path remains unchanged if the specified event is not present in a user path.
Suppose we want to see what happens to the user after she jumps to a
cart event and also to find out which events preceded the cart event.
To do this, we can use TruncatePaths with specified
drop_before='cart' and shift_before=-2:
res = stream.truncate_paths(
          drop_before='cart',
          shift_before=-2
          ).to_dataframe()
Now some users have their trajectories truncated, because they had at
least one cart in their path:
res[res['user_id'] == 219483890]
| event_type | event_index | event | timestamp | user_id | |
|---|---|---|---|---|---|
| 0 | raw | 0 | catalog | 2019-11-01 17:59:13 | 219483890 |
| 1 | raw | 1 | product1 | 2019-11-01 17:59:28 | 219483890 |
| 2 | raw | 2 | cart | 2019-11-01 17:59:29 | 219483890 |
| 3 | raw | 3 | catalog | 2019-11-01 17:59:32 | 219483890 |
| ... | ... | ... | ... | ... | ... |
| 10317 | raw | 10317 | catalog | 2020-02-14 21:04:51 | 219483890 |
As we can see, this path now starts with the two events preceding the
cart (event_index=0,1) and the cart event right after them
(event_index=2). Another cart event occurred here
(event_index=5827), but since the default
occurrence_before='first' was triggered, the data processor
ignored this second cart.
Some users do not have any cart events - and their
trajectories have not been changed:
res[res['user_id'] == 24427596]
| event_type | event_index | event | timestamp | user_id | |
|---|---|---|---|---|---|
| 89 | raw | 89 | main | 2019-11-02 07:28:07 | 24427596 |
| 90 | raw | 90 | catalog | 2019-11-02 07:28:14 | 24427596 |
| 91 | raw | 91 | catalog | 2019-11-02 07:29:08 | 24427596 |
| 92 | raw | 92 | catalog | 2019-11-02 07:29:41 | 24427596 |
We can also perform truncation from the right, or specify for the truncation
point to be not the first but the last occurrence of the cart. To
demonstrate both, let us set drop_after="cart" and
occurrence_after="last":
res = stream.truncate_paths(
          drop_after='cart',
          occurrence_after="last"
          ).to_dataframe()
Now, any trajectory which includes a cart is truncated to the end with the
last cart:
res[res['user_id'] == 219483890]
| event_type | event_index | event | timestamp | user_id | |
|---|---|---|---|---|---|
| 0 | raw | 0 | catalog | 2019-11-01 17:59:13 | 219483890 |
| 1 | raw | 1 | product1 | 2019-11-01 17:59:28 | 219483890 |
| 2 | raw | 2 | cart | 2019-11-01 17:59:29 | 219483890 |
| ... | ... | ... | ... | ... | ... |
| 5639 | raw | 5639 | catalog | 2020-01-06 22:10:15 | 219483890 |
| 5640 | raw | 5640 | cart | 2020-01-06 22:10:42 | 219483890 |
Editing processors#
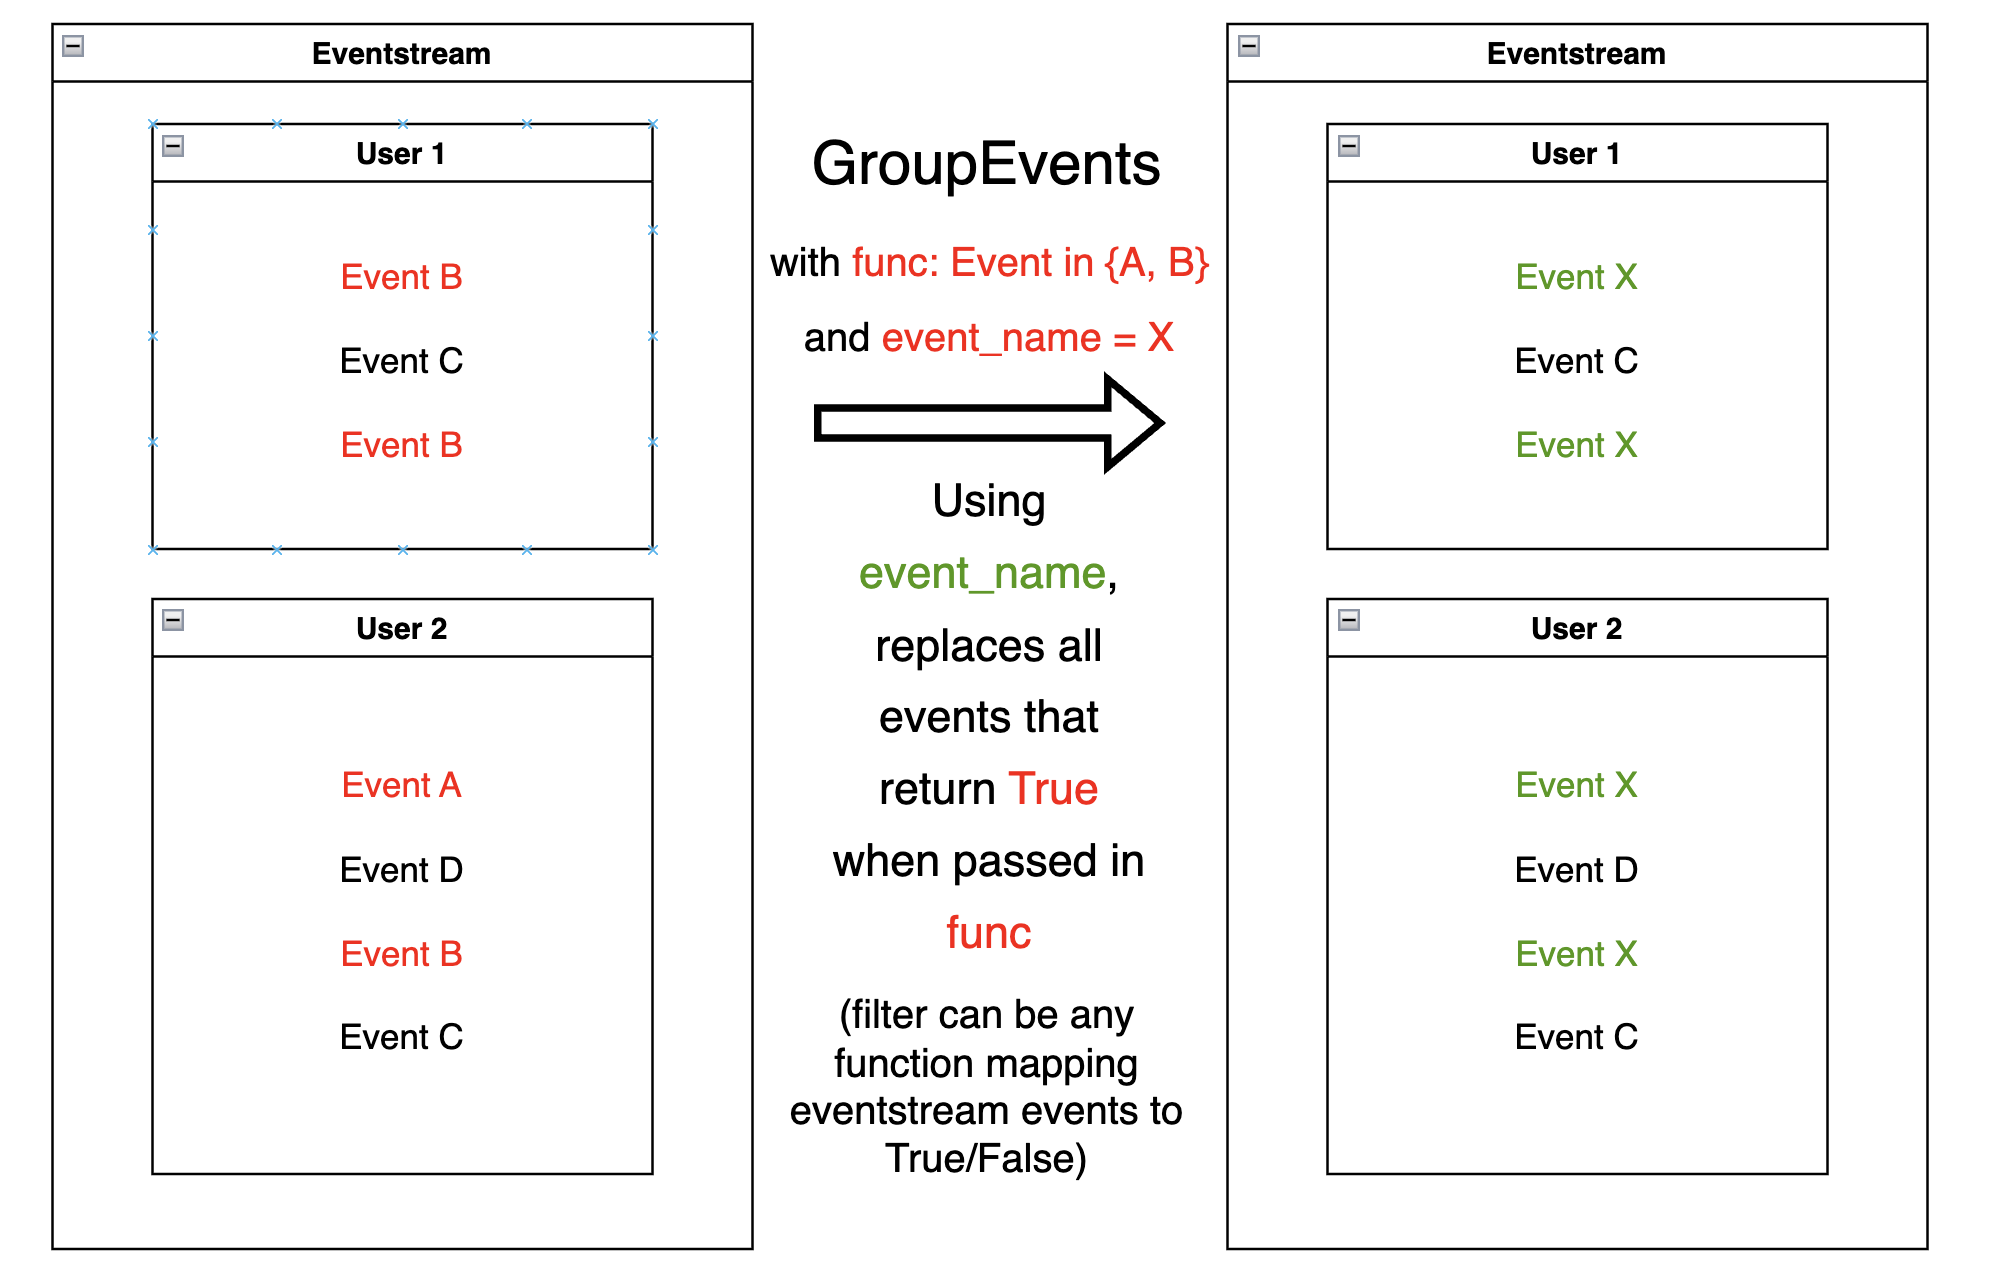
GroupEvents#
Given a masking function passed as a func,
GroupEvents replaces
all the events marked by func with newly created synthetic events
of event_name name and event_type type (group_alias by
default). The timestamps of these synthetic events are the same as their
parents’. func can be any function that returns a series of
boolean (True/False) variables that can be used as a filter for the
DataFrame underlying the eventstream.
With GroupEvents, we can group events based on the event name. Suppose
we need to assign a common name product to events product1 and
product2:
def group_events(df, schema):
    events_to_group = ['product1', 'product2']
    return df[schema.event_name].isin(events_to_group)

params = {
    'event_name': 'product',
    'func': group_events
}

res = stream.group_events(**params).to_dataframe()
As we can see, user 456870964 now has two product events
(event_index=160, 164) with event_type=‘group_alias’).
res[res['user_id'] == 456870964]
| event_type | event_index | event | timestamp | user_id | |
|---|---|---|---|---|---|
| 157 | raw | 157 | catalog | 2019-11-03 11:46:55 | 456870964 |
| 158 | raw | 158 | catalog | 2019-11-03 11:47:46 | 456870964 |
| 159 | raw | 159 | catalog | 2019-11-03 11:47:58 | 456870964 |
| 160 | group_alias | 160 | product | 2019-11-03 11:48:43 | 456870964 |
| 162 | raw | 162 | cart | 2019-11-03 11:49:17 | 456870964 |
| 163 | raw | 163 | catalog | 2019-11-03 11:49:17 | 456870964 |
| 164 | group_alias | 164 | product | 2019-11-03 11:49:28 | 456870964 |
| 166 | raw | 166 | catalog | 2019-11-03 11:49:30 | 456870964 |
Previously, both events were named
product1 and product2 and had raw event types:
stream.to_dataframe().query('user_id == 456870964')
| event_type | event_index | event | timestamp | user_id | |
|---|---|---|---|---|---|
| 140 | raw | 140 | catalog | 2019-11-03 11:46:55 | 456870964 |
| 141 | raw | 141 | catalog | 2019-11-03 11:47:46 | 456870964 |
| 142 | raw | 142 | catalog | 2019-11-03 11:47:58 | 456870964 |
| 143 | raw | 143 | product1 | 2019-11-03 11:48:43 | 456870964 |
| 144 | raw | 144 | cart | 2019-11-03 11:49:17 | 456870964 |
| 145 | raw | 145 | catalog | 2019-11-03 11:49:17 | 456870964 |
| 146 | raw | 146 | product2 | 2019-11-03 11:49:28 | 456870964 |
| 147 | raw | 147 | catalog | 2019-11-03 11:49:30 | 456870964 |
You can also notice that the newly created product events have
event_id that differs from their parents’ event_ids.
Note
schema parameter of the grouping function is optional as well as in
FilterEvents data processor.
GroupEventsBulk#
GroupEventsBulk is a simple extension of the GroupEvents data processor. It allows to apply multiple grouping operations simultaneously. The only positional argument grouping_rules defines grouping rules to be applied to the eventstream.
One option is to define grouping rules as a list of dictionaries. Each dictionary must contain two keys: event_name and func, event_type key is optional. The meaning of the keys is exactly the same as for GroupEvents data processor.
stream.group_events_bulk(
    [
        {
            'event_name': 'product',
            'event_type': 'group_product',
            'func': lambda _df: _df['event'].str.startswith('product')
        },
        {
            'event_name': 'delivery',
            'func': lambda _df: _df['event'].str.startswith('delivery')
        }
    ]
)
An alternative way to set grouping rules is to use a dictionary. The keys and the values are considered as event_name and func correspondingly. Setting event_type is not supported in this case.
stream.group_events_bulk(
    {
        'product': lambda _df: _df['event'].str.startswith('product'),
        'delivery': lambda _df: _df['event'].str.startswith('delivery')
    }
)
Note
If at least two grouping rules might be applied to the same original event, ValueError is thrown. This behaviour is controlled by ignore_intersections flag. If ignore_intersections=True, the first grouping rule is applied in case of such conflicts.
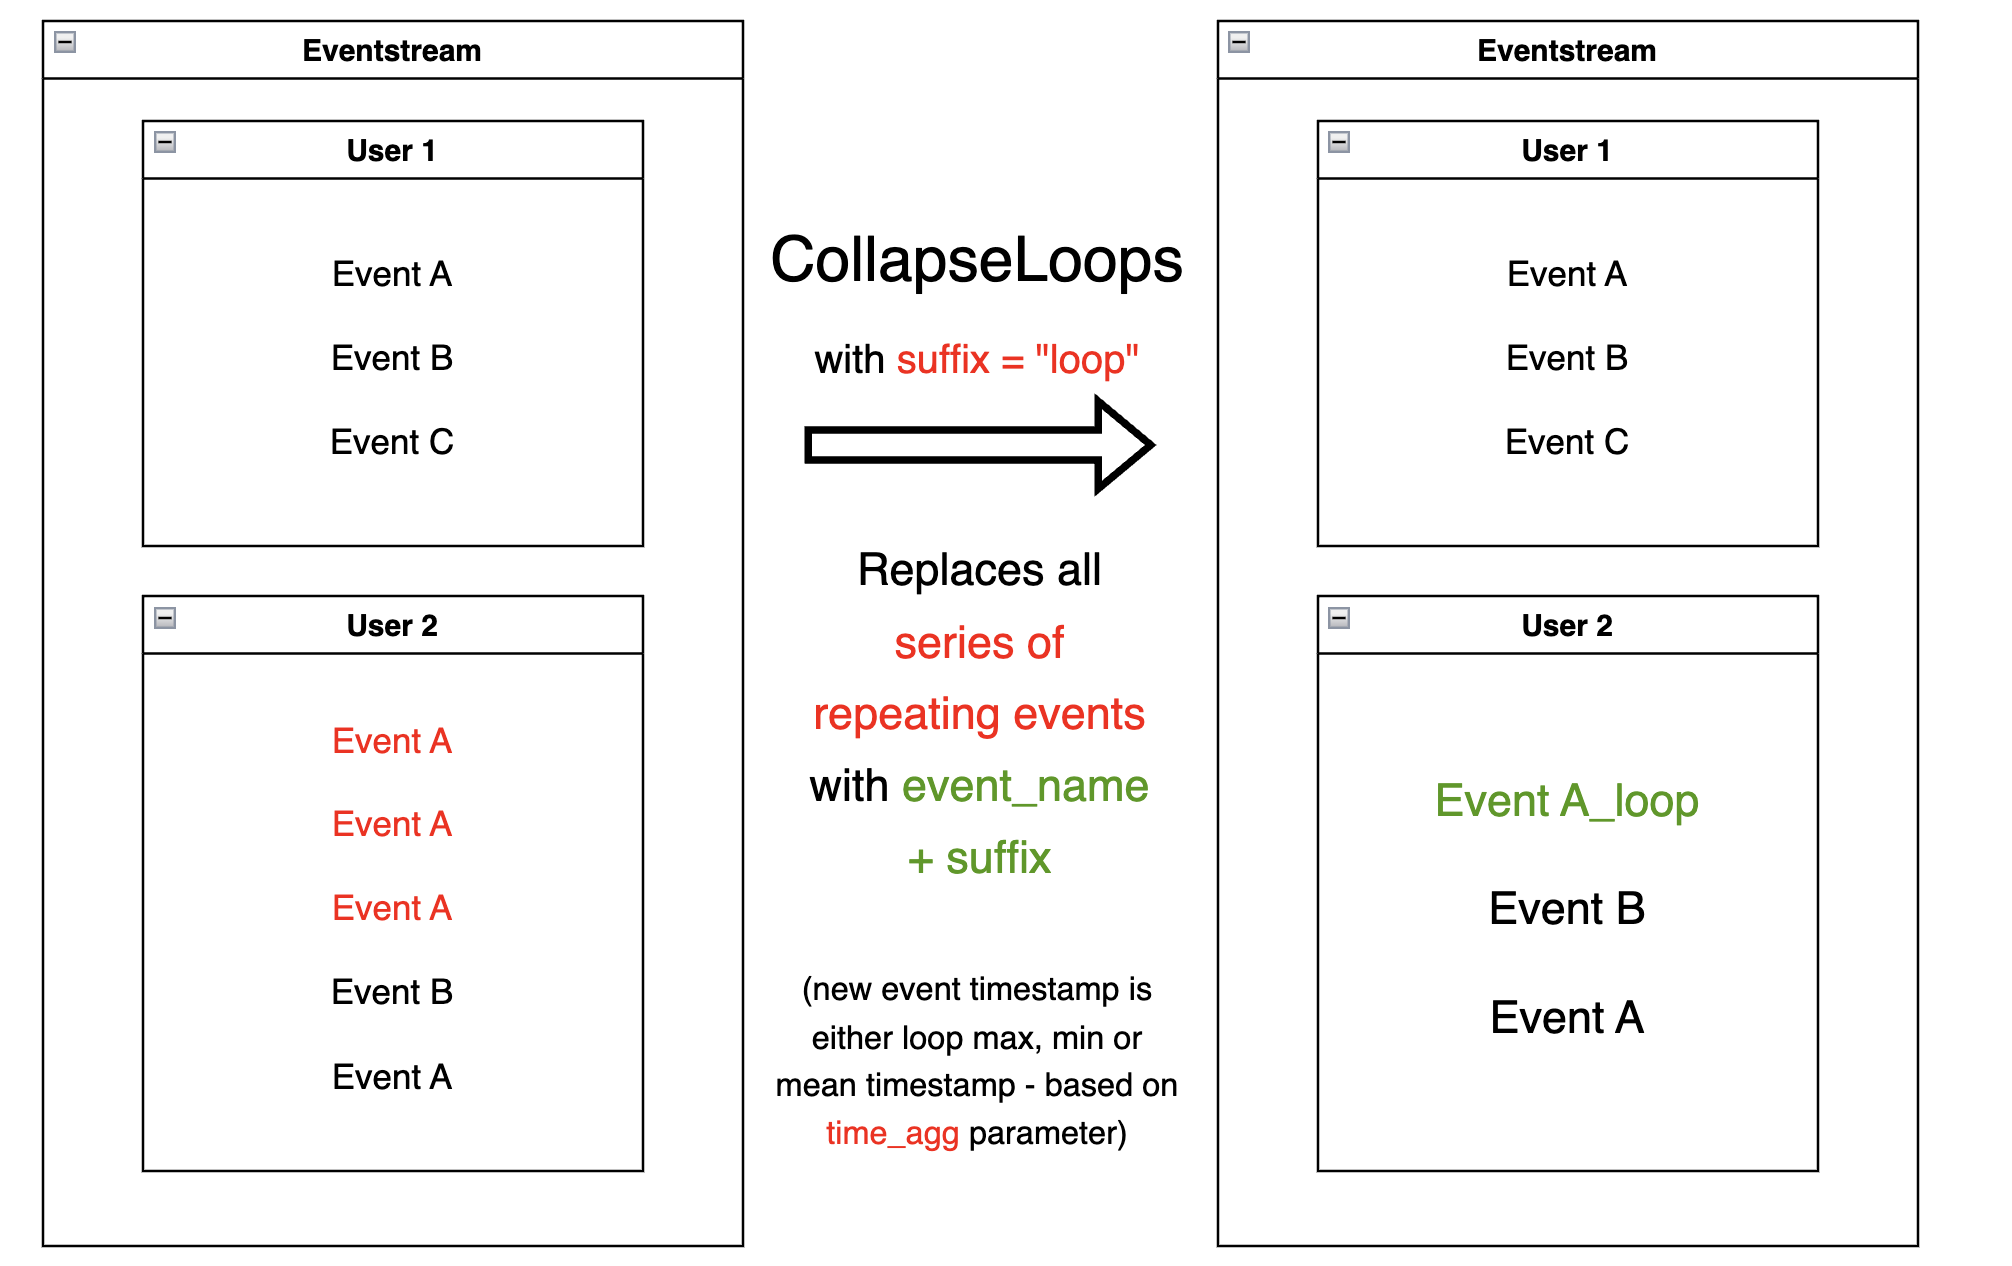
CollapseLoops#
CollapseLoops
replaces all uninterrupted series of repetitive user
events (loops) with one new loop - like event.
The suffix parameter defines the name of the new event:
given
suffix=None, names new event with the old event_name, i.e. passes along the name of the repeating event;given
suffix="loop", names new eventevent_name_loop;given
suffix="count", names new eventevent_name_loop_{number of event repetitions}.
The time_agg value determines the new event timestamp:
given
time_agg="max"(the default option), passes the timestamp of the last event from the loop;given
time_agg="min", passes the timestamp of the first event from the loop;given
time_agg="mean", passes the average loop timestamp.
res = stream.collapse_loops(suffix='loop', time_agg='max').to_dataframe()
Consider for example user 2112338. In the original eventstream she
had three consecutive catalog events.
stream.to_dataframe().query('user_id == 2112338')
| event_type | event_index | event | timestamp | user_id | |
|---|---|---|---|---|---|
| 3327 | raw | 3327 | main | 2019-12-24 12:58:04 | 2112338 |
| 3328 | raw | 3328 | catalog | 2019-12-24 12:58:08 | 2112338 |
| 3329 | raw | 3329 | catalog | 2019-12-24 12:58:16 | 2112338 |
| 3330 | raw | 3330 | catalog | 2019-12-24 12:58:44 | 2112338 |
| 3331 | raw | 3331 | main | 2019-12-24 12:58:52 | 2112338 |
In the resulting DataFrame, the repeating “catalog” events have been collapsed to a single
catalog_loop event. The timestamp of this synthetic event is the
same as the timestamp of the last looping event:
2019-12-24 12:58:44.
res[res['user_id'] == 2112338]
| event_type | event_index | event | timestamp | user_id | |
|---|---|---|---|---|---|
| 5061 | raw | 5061 | main | 2019-12-24 12:58:04 | 2112338 |
| 5066 | group_alias | 5066 | catalog_loop | 2019-12-24 12:58:44 | 2112338 |
| 5069 | raw | 5069 | main | 2019-12-24 12:58:52 | 2112338 |
We can set the suffix to see the length of the loops we removed.
Also, let us see how time_agg works if
we set it to mean.
params = {
    'suffix': 'count',
    'time_agg': 'mean'
}

res = stream.collapse_loops(**params).to_dataframe()
res[res['user_id'] == 2112338]
| event_type | event_index | event | timestamp | user_id | |
|---|---|---|---|---|---|
| 5071 | raw | 5071 | main | 2019-12-24 12:58:04 | 2112338 |
| 5076 | group_alias | 5076 | catalog_loop_3 | 2019-12-24 12:58:23 | 2112338 |
| 5079 | raw | 5079 | main | 2019-12-24 12:58:52 | 2112338 |
Now, the synthetic catalog_loop_3 event has 12:58:23 time -
the average of 12:58:08, 12:58:16 and 12:58:44.
The CollapseLoops data processor can be useful for compressing the
data:
by packing loop information into single events,
removing looping events, in case they are not desirable (which can be a common case in clickstream visualization).
Pipe#
Pipe is a data processor similar to pandas pipe method. It modifies an input eventstream in an arbitrary way by applying given function. The function must accept a DataFrame associated with the input eventstream and return a new state of the modified eventstream.
stream.pipe(lambda _df: _df.assign(new_column=100))\
    .to_dataframe()\
    .head(3)
| user_id | event | timestamp | new_column | |
|---|---|---|---|---|
| 0 | 219483890 | path_start | 2019-11-01 17:59:13.273932 | 100 |
| 1 | 219483890 | catalog | 2019-11-01 17:59:13.273932 | 100 |
| 2 | 219483890 | product1 | 2019-11-01 17:59:28.459271 | 100 |
Synthetic events order#
Let us summarize the information about event type and event order in the eventstream. As we have already discussed in the eventstream guide: event_type column and reindex method.
All events came from a sourcing DataFrame are of raw event type.
When we apply adding or editing data processors new synthetic events are created.
General idea is that each synthetic event has a “parent” or “parents” that
defines its timestamp.
When you apply multiple data processors, timestamp collisions might occur, so it is unclear how the events should be ordered. For colliding events, the following sorting order is applied, based on event types (earlier event types are added earlier), also you can see which data processor for which event_type is responsible:
Order |
event_type |
helper |
|---|---|---|
1 |
profile |
|
2 |
path_start |
|
3 |
new_user |
|
4 |
existing_user |
|
5 |
cropped_left |
|
6 |
session_start |
|
7 |
session_start_cropped |
|
8 |
group_alias |
|
9 |
raw |
|
10 |
raw_sleep |
|
11 |
None |
|
12 |
synthetic |
|
13 |
synthetic_sleep |
|
14 |
add_positive_events |
|
15 |
add_negative_events |
|
16 |
session_end_cropped |
|
17 |
session_end |
|
18 |
session_sleep |
|
19 |
cropped_right |
|
20 |
absent_user |
|
21 |
lost_user |
|
22 |
path_end |