StepSankey#
![]()

Loading data#
Throughout this guide we use our demonstration simple_shop dataset. It has already been converted to Eventstream and assigned to stream variable. If you want to use your own dataset, upload it following this instruction.
from retentioneering import datasets

stream = datasets.load_simple_shop()
Basic example#
The step Sankey diagram represents eventstream as a stepwise directed graph. The nodes are associated with events that appear at a particular step in a user’s trajectory. The nodes are sorted from left to right according to the ordinal number of step (1, 2, etc). The edges visualize how often transition from, say, event A happened at i-th step to event B happened at i+1-th step occurred. The nodes and edges sizes reflect the number of unique users involved.
The step Sankey diagram in some sense is an extension of the step matrix diagram. The latter shows the distribution of the events with respect to an ordinal step, but in addition the step Sankey chart reflects connections between adjacent steps which the step matrix lacks of. Hence, step Sankey inherits many features that step matrix have, so we recommend you to read Step matrix user guide before you read this document.
The implementation is based on the Plotly Sankey diagram and inherits all the benefits from its parent. In particular, the diagram is interactive, so you can hover the nodes and edges and look at the detailed info, move the nodes, and even merge them (to merge use Box Select or Lasso Select tools located at the top-right corner on hover).
The primary way to build a step Sankey diagram graph is to call Eventstream.step_sankey() method. Here is how it visualizes simple_shop eventstream:
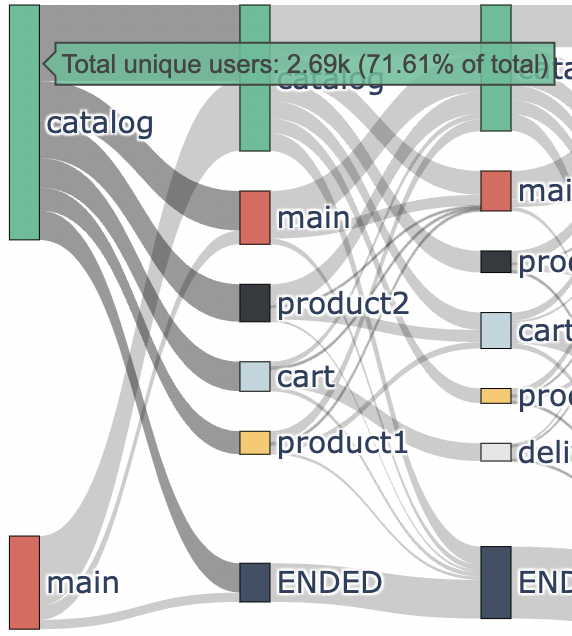
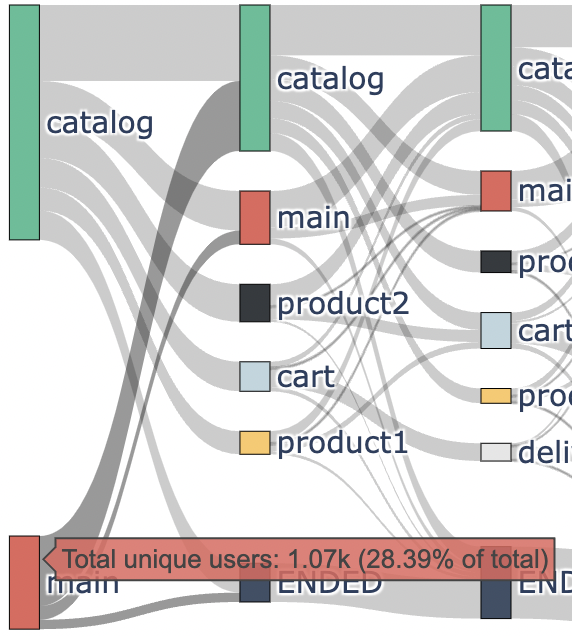
stream.step_sankey(max_steps=5)
Here we can see user flow. The nodes are grouped into columns in stepwise manner. The first column corresponds to the events that occurred at the users’ first step, the second column corresponds to the second step and so on. The height of a rectangle representing a node is proportional to the frequency this particular event occurred at this particular step. From this diagram we can see (if we hover the mouse cursor on the node) that at the first step the catalog event appeared 2.69K times (71.61% of the users) whereas the main event appeared 1.07K times (28.39% of the users). That is why the red rectangular (for the catalog event) is ~2.5 times higher than the green rectangular (for the main event). The percentage of the users is calculated with respect to all the users participating in the parent eventstream.
An edge’s width is proportional to the frequency of this transition in the eventstream. Hovering the mouse on the edges, you can reveal not only these frequencies, but also the info on how long a transition took the users on average. For example, we can see that the transition catalog (1st step) -> catalog (2nd step) appeared in 869 paths, and it took 29 seconds on average.
|
|
|

Finally, we mention that max_steps arguments we used above denotes the number of the steps to be displayed in the diagram (starting from the 1st step).
Note
The charts in this user guide are usually quite wide, so do not forget to use horizontal scroll bar to see the entire visualization.
Terminating event#
Similar to step matrix, step Sankey diagram uses the idea of synthetic ENDED event. This event is padded in the end of short paths (meaning that their length is less than max_steps) so that their length becomes exactly max_path. See Step matrix user guide for the details.
Having ENDED event implemented guarantees that the sum of the user shares over each column (i.e. each step) is exactly 1. ENDED is always placed at the bottom of the diagram. The following example demonstrates this (we temporarily set threshold=0 for the comparison purposes, see the next section).
stream.step_sankey(max_steps=5, threshold=0)
In this diagram we see that ENDED appears at the 2nd step and involves 443 users. At the 3rd step ENDED event contains 823 users, and for 443 of them the event have been propagated from the previous step.
Collapsing rare events#
As in the case of the step matrix, it is reasonable to collapse rare events in the step Sankey diagram since these events make the diagram excessively noisy. This behaviour is controlled by the threshold argument. An event is considered as rare if its maximum frequency over all the steps represented in the diagram is less than threshold. The threshold might be of whether int or float type. The former stands for the limit for the absolute number of the users, the latter stands for the percentage of the users. All these rare events are not removed from the diagram, but collapsed to the thresholded_N artificial event instead, where N stands for the number of the collapsed events. The thresholded_N event appears in the step Sankey diagram only and is not added to the parent eventstream.
The default value for threshold is 0.05. Let us look how the events are collapsed if we set threshold=0.1 and compare the result with the previous diagram (with threshold=0 parameter).
stream.step_sankey(max_steps=5, threshold=0.1)
We see that thresholded_5 event has appeared. As you might have noticed, it contains product1, payment_choice, delivery_choice, delivery_courier, and delivery_pickup. Let us explain why, for example, the product1 event has been collapsed. Look at the first chart with threshold=0. The product1 event contains 7.01%, 4.51, 4.27, and 3.2% of the users at steps 2, 3, 4, 5 correspondingly. Since the maximum value (7.01%) is less than threshold=0.1, the event has been collapsed.
Please also note that the number _5 in the thresholded_5 event name carries no information about a specific step. For example, from the chart with threshold=0 we see that at step 2 only one event among these 5 is represented (product1), so it is the only event which is collapsed at this step. On the other hand, at step 3 product1 and delivery_choice appear, so they are collapsed to thresholded_5 event. Finally, at step 5 all these 5 events are collapsed.
If you want to prevent some events from collapsing, use the targets parameter then. We evolve the previous example, but now we are aiming to drag product1 and delivery_choice events out from the thresholded_5 event, so we put them into the targets list.
stream\
    .step_sankey(
        max_steps=5,
        threshold=0.1,
        targets=['product1', 'delivery_choice']
    )
Look at step 2. What we see is that thresholded_5 event has disappeared completely, and product1 has been revealed instead. At step 3 there is no thresholded_5 event too. It has been replaced by product1 and delivery_choice. Finally, at step 4 we see a couple of target events product1 and delivery_choice, but thresholded_3 event is also represented here. It still contains 3 events: delivery_courier, delivery_pickup, and payment_choice.
Events sorting#
Intuitively, the events order within a column depends on the corresponding user shares at a particular step. It is true in many cases, but this is not the only logic considered. The sorting algorithm also takes into account when (at which step) an event appears in the diagram for the first time. The algorithm ranks higher the events which appear earlier even if their frequency is low at a particular step.
To illustrate this logic consider a dummy eventstream:
from retentioneering.eventstream import Eventstream

dummy_stream = Eventstream(
    pd.DataFrame(
        [
            [1, 'event1', '2023-01-01 00:00:00'],
            [1, 'event1', '2023-01-01 00:00:00'],
            [2, 'event1', '2023-01-01 00:00:00'],
            [2, 'event2', '2023-01-01 00:00:00'],
            [3, 'event1', '2023-01-01 00:00:00'],
            [3, 'event2', '2023-01-01 00:00:00'],
            [4, 'event1', '2023-01-01 00:00:00'],
            [4, 'event2', '2023-01-01 00:00:00'],
        ],
        columns=['user_id', 'event', 'timestamp']
    )
)
dummy_stream.step_sankey(max_steps=4)
From this chart we see that there is no event2 spotted at step 1. However, at step 2, despite the dominance of event2 (75% of the users at step 2 had event2), event1 is placed higher since it is considered “older” than event2.
Using a separate instance#
By design, Eventstream.step_sankey() is a shortcut method that uses StepSankey class under the hood. This method creates an instance of StepSankey class and embeds it into the eventstream object. Eventually, Eventstream.step_sankey() returns exactly this instance.
Sometimes it is reasonable to work with a separate instance of StepSankey class. An alternative way to get the same visualization that Eventstream.step_sankey() produces is to call StepSankey.fit() and StepSankey.plot() methods explicitly. The former method calculates all the values needed for the visualization, the latter displays these values as a Sankey diagram.
from retentioneering.tooling.step_sankey import StepSankey

step_sankey = StepSankey(stream)
step_sankey.fit(max_steps=5, threshold=0.1)
step_sankey.plot()
Common tooling properties#
values#
Since the StepSankey object is essentially a graph, it is natural to get the underlying values as the data on the graph’s nodes and edges. So StepSankey.values property returns two pandas.DataFrame objects. The first relates to the nodes, the second relates to the edges. show_plot=False in the examples below is needed to suppress displaying the diagram.
# StepSankey graph nodes
stream\
    .step_sankey(show_plot=False)\
    .values[0]
| step | event | usr_cnt | usr_cnt_total | perc | color | index | sorting | order_by | |
|---|---|---|---|---|---|---|---|---|---|
| 0 | 1 | catalog | 2686 | 3751 | 71.61 | (80, 190, 151) | 0 | 100 | 100 |
| 1 | 1 | main | 1065 | 3751 | 28.39 | (228, 101, 92) | 1 | 100 | 100 |
| 2 | 2 | catalog | 1670 | 3751 | 44.52 | (80, 190, 151) | 2 | 100 | 0 |
| 3 | 2 | main | 609 | 3751 | 16.24 | (228, 101, 92) | 3 | 100 | 1 |
| 4 | 2 | product2 | 429 | 3751 | 11.44 | (53, 58, 62) | 4 | 100 | 100 |
# StepSankey graph edges
stream\
    .step_sankey(show_plot=False)\
    .values[1]
| step | event | next_event | usr_cnt | time_to_next_sum | index | next_step | next_index | |
|---|---|---|---|---|---|---|---|---|
| 0 | 1 | catalog | catalog | 869 | 0 days 07:05:31.308030 | 0 | 2 | 2 |
| 1 | 1 | catalog | main | 452 | 2228 days 01:07:48.656824 | 0 | 2 | 3 |
| 2 | 1 | catalog | product2 | 429 | 0 days 01:12:27.870236 | 0 | 2 | 4 |
| 3 | 1 | catalog | cart | 337 | 0 days 02:31:57.294871 | 0 | 2 | 5 |
| 4 | 1 | catalog | ENDED | 336 | 0 days 00:00:00 | 0 | 2 | 7 |
params#
StepSankey.params property returns a dictionary containing all the parameters (including the defaults) related to the current state of the StepSankey object:
# StepSankey graph nodes
stream\
    .step_sankey(show_plot=False)\
    .params
{'max_steps': 10,
 'threshold': 0.05,
 'sorting': None,
 'targets': None,
 'autosize': True,
 'width': None,
 'height': None}