Funnel#
![]()

Loading data#
Throughout this guide we use our demonstration simple_shop dataset. It has already been converted to Eventstream and assigned to stream variable. If you want to use your own dataset, upload it following this instruction.
from retentioneering import datasets

stream = datasets.load_simple_shop()
Basic example#
Building a conversion funnel is a basic first step for many product analysis studies. Basically, funnel is an approach to quantify how many users followed a specific event pattern. The simplest way to build a funnel using retentioneering library is to call Eventstream.funnel() method. The implementation is based on Plotly funnel charts.
Here’s the funnel visualisation on how many users walked through catalog → cart → payment_done route in simple_shop eventstream:
stream.funnel(stages=['catalog', 'cart', 'payment_done'])
This funnel illustrates that there are 3611 users who reached catalog event. 1924 of them also reached cart event after they had already reached catalog event (perhaps, there were some other events between catalog and cart). 653 out of these 1924 users followed catalog → ... → cart → ... → payment_done path. Thus, we guarantee that the users who form a specific stage of a funnel appeared at all the previous stages. This type of the funnel is called closed funnel. Some other types are supported as well. See here for details. The percentage values show the conversion rates either from the previous or from the first stage.
Funnel stages#
stages is a required parameter. It should contain a list of event names you would like to observe in the funnel. For each stage event specified, the following statistics are calculated:
the number of the users who reached this stage according to the funnel logic defined in funnel_type parameter;
the conversion rate from the first stage to the current one (% of initial);
the conversionrate from the previous stage to the current one (% of previous).
The order of the stages on the funnel plot is induced by the stage order represented in stages parameter.
Stage grouping#
In many practical cases, we would like to group multiple events into a single stage - for example, if it does not matter which particular event was reached. We can access this by passing lists of events (along with single events) in the stage parameter.
Let us plot a funnel where product1 and product2 events are grouped into a single stage:
stream.funnel(stages=['catalog', ['product1', 'product2'], 'cart', 'payment_done'])
As you can see, a new product1 | product2 stage is created in the funnel. It means that 2010 unique users reached a product page (at least one of product1 or product2) after they had reached catalog event.
Note
If a user has both of the events product1 and product2 appeared after catalog event, the user is still counted as one at this stage.
Stage names#
As you may have noticed, providing the grouped stage values like ['product1', 'product2'] induces complex stage names in the funnel plot. It might be fixed by assigning the aliases for stage names with stage_names parameter. The length of the stage_names list must be the same as the length of the stages list.
stream.funnel(
    stages=['catalog', ['product1', 'product2'], 'cart', 'payment_done'],
    stage_names=['catalog', 'product', 'cart', 'payment_done']
)
Note
In case you have many events to group, it would be reasonable to use GroupEvents data processor before applying funnel tool instead of grouping the events with stages parameter.
Funnel types#
Three funnel types are supported. funnel_type parameter accepts one of open, closed, and hybrid parameters. In this section we will step back from the simple_shop dataset and will explain how all three funnel types are designed on a simplified example.
Suppose we have an evenstream that consists of 5 users and 4 unique events A, B, C, and D as it is shown on the image below.
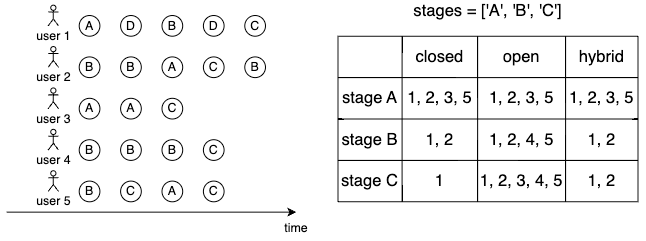
Suppose also that we want to build the funnels of all three types with the same parameter stages=['A', 'B', 'C']. The table on the right shows the distribution of the user ids over each stage for each funnel type. Below are the explanations on how each funnel type is designed.
Closed funnel#
As we have already discussed in the basic example, for closed funnel these stages define a path pattern A → ... → B → ... → C. This means that the users at the first stage of the funnel must contain A event (4 users), the users at the second stage must have a sub-path A → ... → B (2 users), and finally the users at the third stage must contain A → ... → B → ... → C (1 user). The ellipsis means that any number of any events may lay in place of it.
This sequential manner of building the stages guarantees that the users at each stage have passed all the previous stages. That is actually why funnel has its name: the set of the users narrows passing from on stage to another (or, strictly speaking, it does not extend). Closed funnels are useful when we need to track how the users move from one step in their paths to another according to stages pattern.
Open funnel#
In contrast to closed funnel, open funnel pays attention to the fact whether a stage event is represented in a user’s path or not. It ignores the order of appearance of events in user paths. Thus, at the first stage there are users who had at least one A event (4 users), at the second stage there are the users who had at least one B event (4 users), and the same for the third stage (5 users). As you may have noticed, according to the open funnel definition, the funnel numbers will not change if we change the order of stages events.
Hybrid funnel#
Hybrid funnels inherit the logic of both open and closed funnels. The first stage of a hybrid funnel is formed by the users who experienced A event (4 users). That is why the users at this stage are identical to the users of open and closed funnel at this stage. Next, to form the second stage of the funnel we consider only the users who experienced event B after event A. So far the logic is the same as for closed funnel, and that is why the users at the second level of the hybrid funnel are the same as the users at the second level of the closed funnel (2 users). However, at the third stage we can see some differences with the closed funnel.
We consider the users from the previous stage. Among these users we select only those who experienced event C after event A disregard whether it happened after B event or not. Hence, we include user 2``at the third stage: she has ``C appeared after event A, and she also has event B appeared after event A. We are not interested in the fact that C happened before B. On the other hand, we do not include user 5 at the third stage despite the fact she has event C appeared after event A. The reason is that she did not appear at the previous stage.
User segments#
It can be useful to build separate funnels for different user groups, and compare them stage-by-stage in a single plot image.
Groups of users can be represented by:
the users from different marketing channels,
the users from experimental and control groups in A/B test,
the users from different behavioral segments.
To make this, we can pass collections of the user ids to groups parameter. Let us plot funnels for two user cohorts: for January 2021 and for February 2021.
stream_df = stream.to_dataframe()

# pandas.Series, indicies are user_ids, values are months when users appear
cohorts = stream_df.groupby('user_id').first()['timestamp'].dt.strftime('%Y-%m')

segment1 = cohorts[cohorts == '2020-01'].index
segment2 = cohorts[cohorts == '2020-02'].index

stream.funnel(
    stages=['catalog', ['product1', 'product2'], 'cart', 'payment_done'],
    stage_names=['catalog', 'product', 'cart', 'payment_done'],
    funnel_type='closed',
    segments=(segment1, segment2),
    segment_names=('converted', 'not_converted')
)
Now we see how the two groups differ at particular stages. Namely, we notice that the January cohort has better conversion rates at each stage: 58% VS 52% for catalog → product transition, 66% VS 63% for product → cart transition, and 33% VS 25% for cart → payment_done transition. As a result, the overall conversion rate for catalog → payment_done for the January cohort is better (12% VS 8%). However, the observed difference might be obtained by chance. To estimate this explicitly, we need to test statistical hypothesis.
Using a separate instance#
By design, Eventstream.funnel() is a shortcut method that uses Funnel class under the hood. This method creates an instance of Funnel class and embeds it into the eventstream object. Eventually, Eventstream.funnel() returns exactly this instance.
Sometimes it is reasonable to work with a separate instance of Funnel class. An alternative way to get the same visualization that Eventstream.funnel() produces is to call Funnel.fit() and Funnel.plot() methods explicitly. The former method calculates all the values needed for the visualization, the latter displays these values as a funnel.
Here is an example how you can manage it:
from retentioneering.tooling.funnel import Funnel

funnel = Funnel(eventstream=stream)
funnel.fit(stages=['catalog', 'cart', 'payment_done'])
funnel.plot()
Common tooling properties#
values#
Funnel.values property returns the values underlying recent Funnel.plot() call. The property is common for many retentioneering tools. It allows you to avoid unnecessary calculations if the tool object has already been fitted.
stream.funnel(
    stages=['catalog', 'cart', 'payment_done'],
    show_plot=False
).values
| unique_users | %_of_previous | %_of_initial | ||
|---|---|---|---|---|
| segment_name | stages | |||
| all users | catalog | 3611 | 100.00 | 100.00 |
| cart | 1924 | 53.28 | 53.28 | |
| payment_done | 653 | 33.94 | 18.08 |
params#
Funnel.params property returns the Funnel parameters that was used in the last Funnel.fit() call.
stream.funnel(
    stages=['catalog', 'cart', 'payment_done'],
    show_plot=False
).params
{'stages': [['catalog'], ['cart'], ['payment_done']],
 'stage_names': ['catalog', 'cart', 'payment_done'],
 'funnel_type': 'closed',
 'segment_names': ['all users']}