Step matrix#
![]()

Step matrix definition#
Step matrix is a powerful tool in the Retentioneering arsenal. It allows and getting a quick high-level understanding of user behavior. The step matrix features powerful customization options to tailor the output depending on the goal of the analysis.
To better understand how the step matrix works, let us first consider an intuitive example. Assume we have an eventstream as follows:
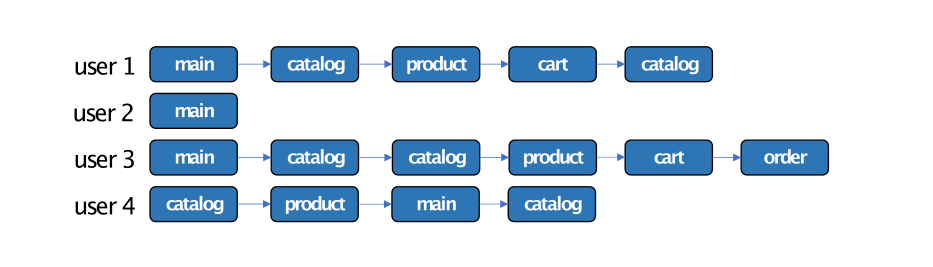
We can visualize this dataset as a step-wise heatmap, indicating the distribution of the events appeared at a specific step:
import pandas as pd
from retentioneering.eventstream import Eventstream
simple_example = pd.DataFrame(
    [
        ['user1', 'main', 0],
        ['user2', 'main', 0],
        ['user3', 'main', 0],
        ['user4', 'catalog', 0],
        ['user1', 'catalog', 1],
        ['user3', 'catalog', 1],
        ['user4', 'product', 1],
        ['user1', 'product', 2],
        ['user3', 'catalog', 2],
        ['user4', 'main', 2],
        ['user1', 'cart', 3],
        ['user3', 'product', 3],
        ['user4', 'catalog', 3],
        ['user1', 'catalog', 5],
        ['user3', 'cart', 5],
        ['user3', 'order', 6]
    ],
    columns=['user_id', 'event', 'timestamp']
)


Eventstream(simple_example)\
    .step_matrix(max_steps=7, threshold=0);
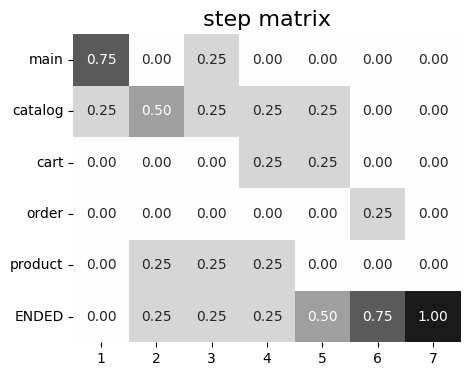
The matrix rows correspond to the unique events, and the columns correspond to the steps in the user
trajectories. That is, (i, j) matrix element shows the share of the users with event i appeared at step j.
Hereafter we use simple_shop dataset, which has already been converted to Eventstream and assigned to stream variable. If you want to use your own dataset, upload it following this instruction.
from retentioneering import datasets

stream = datasets.load_simple_shop()
Basic example#
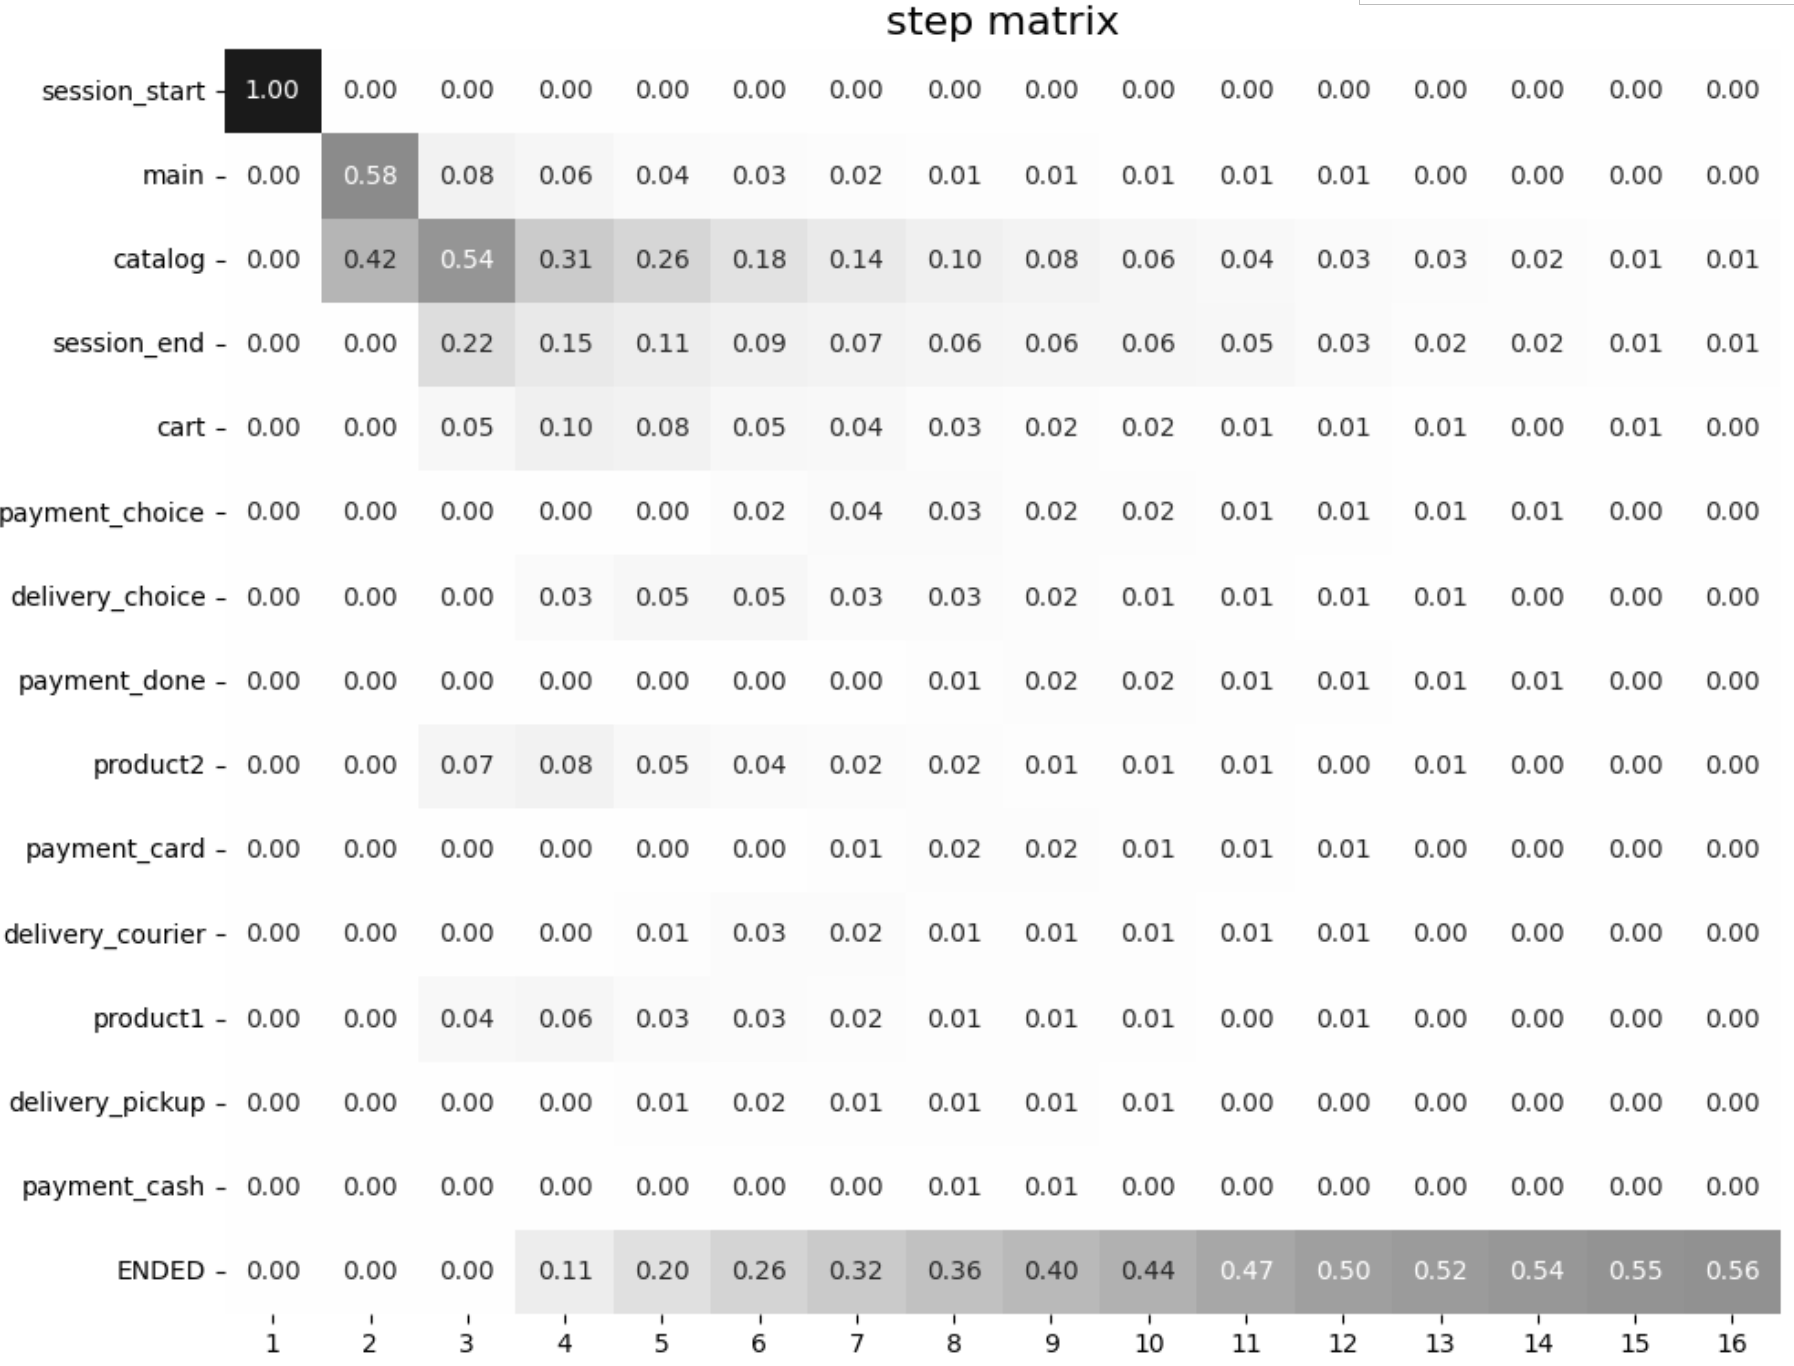
The primary way to visualize a step matrix is to call Eventstream.step_matrix() method. Here is how it is applied to simple_shop eventstream:
stream.step_matrix(max_steps=12, threshold=0)
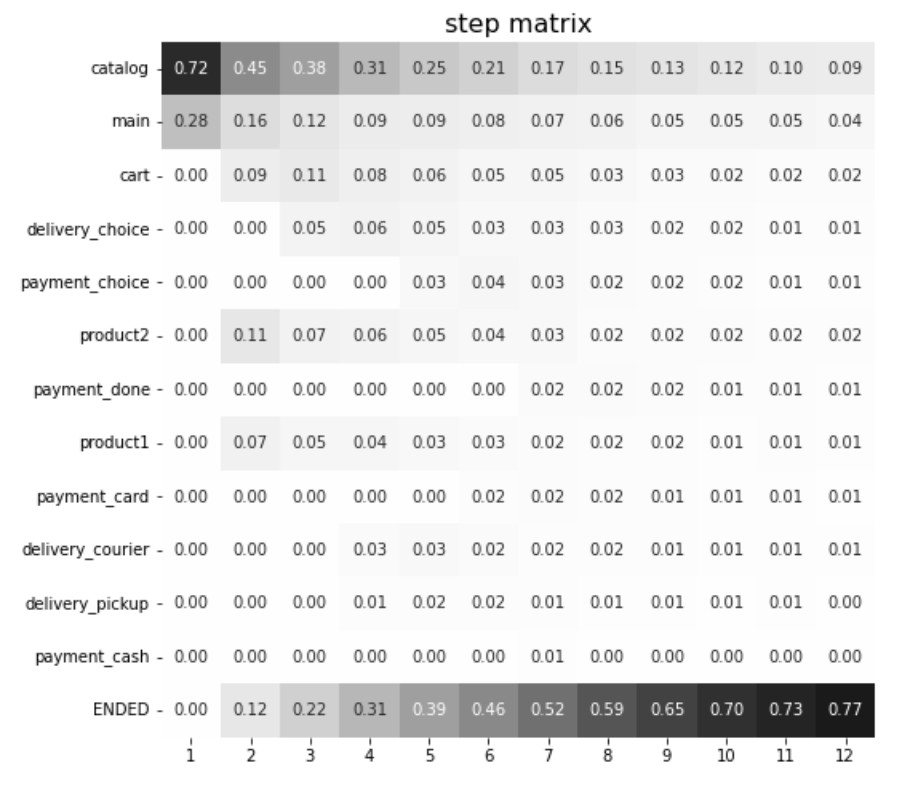
As we can see, the sum of the values in the matrix columns is 1 (i.e. at each step). Looking at the first column we can say that the users start their sessions from events catalog (72%) and main (28%). Also, we notice that payment_done event, which might be considered as an event of interest, appears in the trajectories no earlier than at the 7th step (row payment_done has zeros until step 7).
Terminating event#
As you may have noticed, the step matrix above has ENDED event which is located in the last row, whereas this event is not represented in the simple_shop eventstream. ENDED is a special synthetic event that explicitly indicates a trajectory’s end. If a user’s path is shorter than max_steps parameter, then ENDED event is padded to the path so that it becomes exactly of length max_steps. With this behavior, the sum of the user fractions over each column (i.e each step) is exactly 1. Essentially, ENDED row represents the cumulative share of leaving users. The event exists in scope of step matrix only, so that it does not affect the sourcing eventstream at all.
Collapsing rare events#
In a typical scenario, it can be useful to hide rare events in a step matrix, not removing them from the step matrix calculation. If we remove them, the matrix values will be distorted. This behaviour is controlled by the threshold argument. An event is considered as rare if its maximum frequency over all the steps is less than threshold. All such rare events are not removed from the matrix, but instead collapsed to thresholded_N artificial event, where N stands for the number of the collapsed events. The thresholded_N event appears in step matrix only, and is not added to the sourcing eventstream.
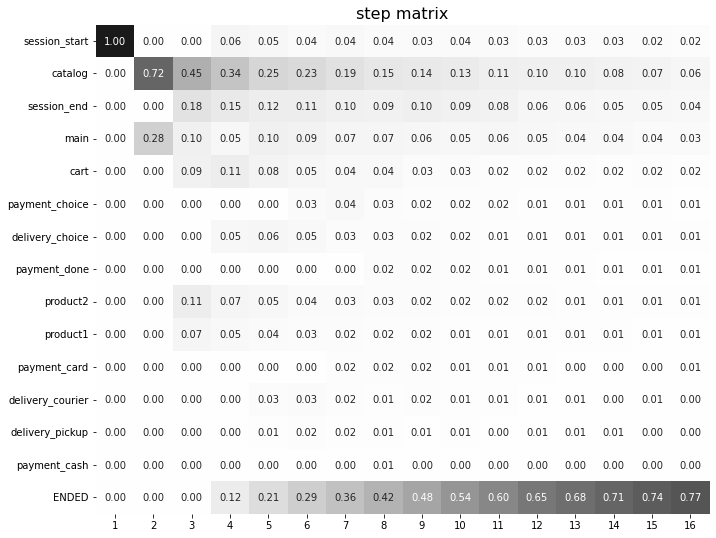
Let us look how the events are collapsed if we set threshold=0.05, and compare the result with the previous step matrix (which had threshold=0 parameter).
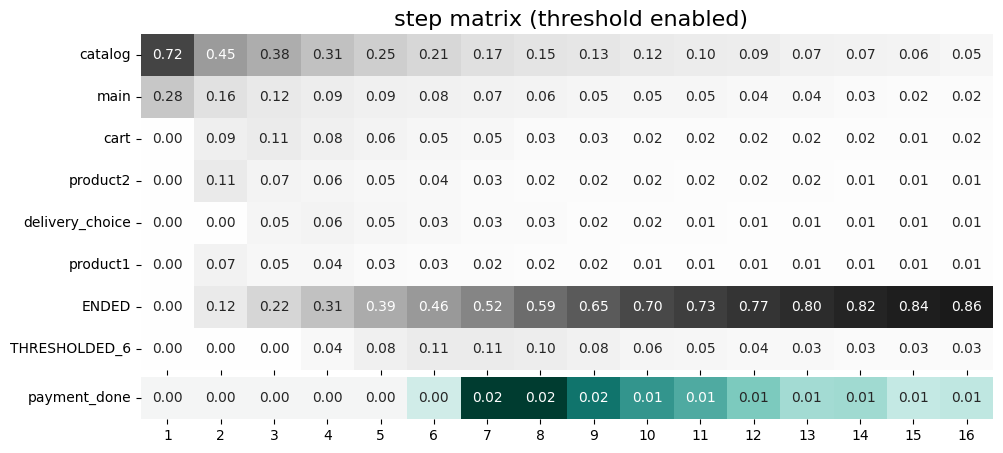
stream.step_matrix(max_steps=16, threshold=0.05)
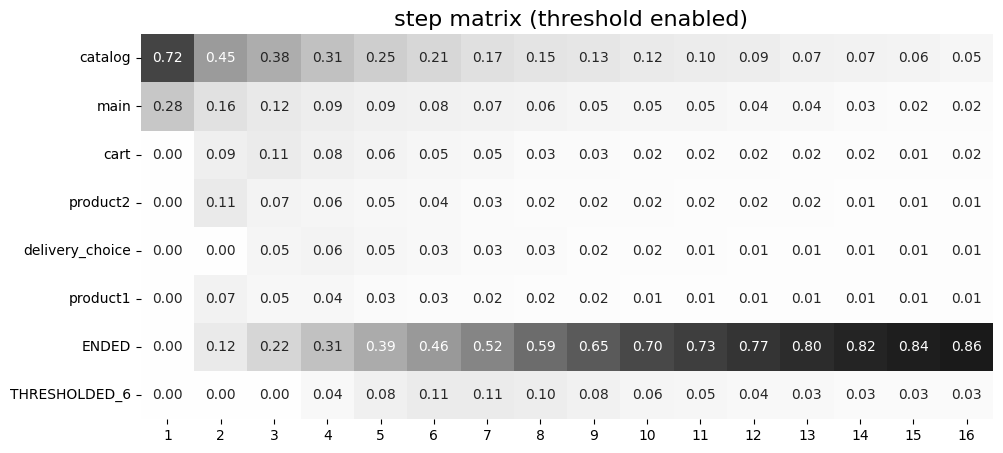
Now, we see that all 6 rare events are hidden and grouped together in the THRESHOLDED_6 row. We also notice that THRESHOLDED_6 event contains delivery_courier, delivery_pickup, payment_cash, payment_card, payment_done, and payment_choice events. Let us check why, say, the payment_choice event has been collapsed. In the previous step matrix we see that at step 5 this event contains 3% of the users, 4% at step 6, and 3% at step 7, etc. Since the maximum value (4%) is less than
threshold=0.05, the event is collapsed.
Note that the number _6 in THRESHOLDED_6 event name contains no information on specific steps. For example, from the matrix with threshold=0 we see that at step 4 only one event among these 6 is represented (delivery_courier), so it is the only event that is collapsed at this step. On the other hand, at step 5 delivery_pickup and payment_choice appear, so they are collapsed to the THRESHOLDED_6 event. Finally, at step 7, all these 6 events are collapsed.
You can use the target parameter if you want to prevent some events from the collapsing.
Target events analysis#
It is common that some events are more important than the others, so we want to pay attention to them.
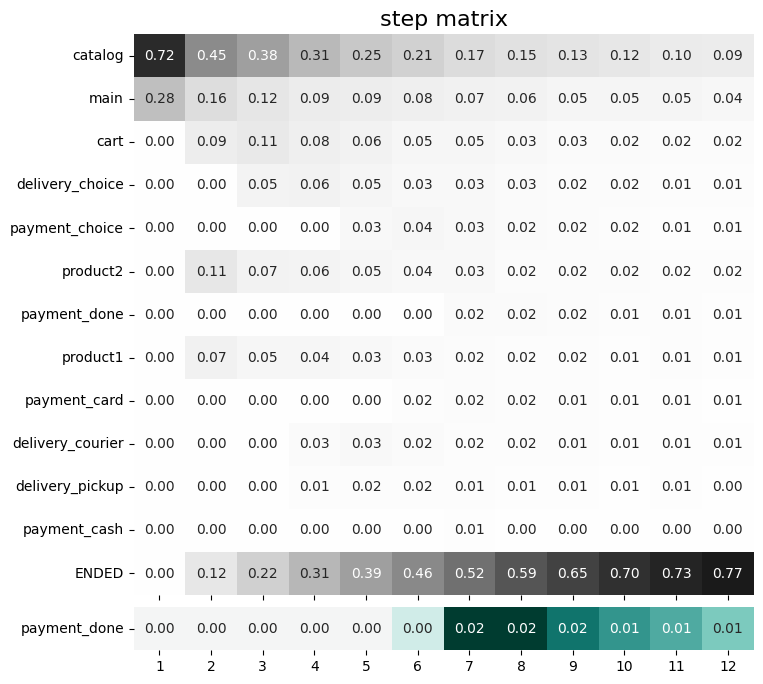
This includes such events as adding an item to the cart, order confirmation, payment, etc. Such events often have much lower occurrence rate compared to other events (like visiting main page or catalog). As a result, they are collapsed to the THRESHOLDED_N event. Even if they are not, it would be worth highlighting them in the diagram at putting them in separate place. This can be done with the targets parameter:
stream.step_matrix(
    max_steps=16,
    threshold=0.05,
    targets=['payment_done']
)
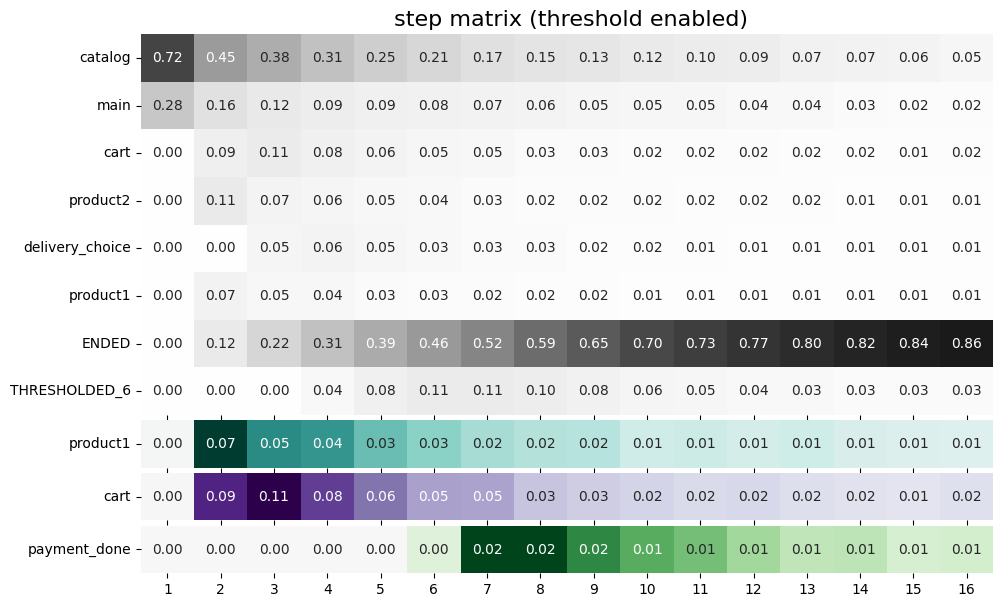
Specified target events are always shown at the bottom of step matrix regardless of the selected threshold. As we have chosen the payment_done event as a target, the row with payment_done has been moved at the bottom of the matrix and now has its own color palette.
Multiple targets are also supported:
stream.step_matrix(
    max_steps=16,
    threshold=0.05,
    targets=['product1', 'cart', 'payment_done']
)
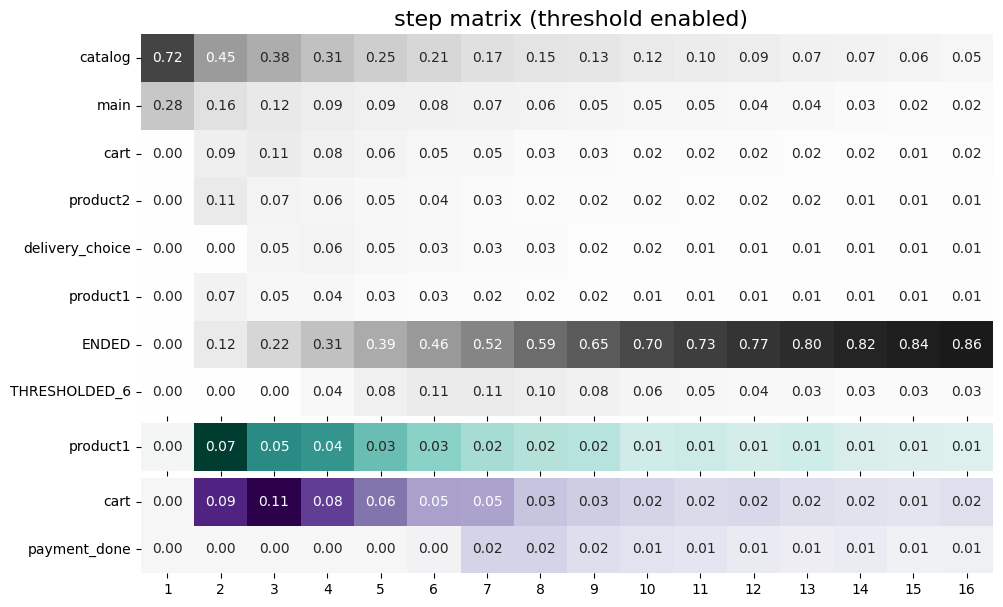
Now we have selected three target events: product1, cart, payment_done, so we can see them at the bottom of the diagram. Each of them has its own palette and color scaling.
If we want to compare some target events and plot them using the same color scaling, we can combine them in a sub-list inside the targets list:
stream.step_matrix(
    max_steps=16,
    threshold=0.05,
    targets=['product1', ['cart', 'payment_done']]
)
With the colors defined in this way, we can compare how many users reached cart vs payment_done at particular step in their trajectories.
Targets can be presented as accumulated values with accumulated parameter. Meaning that, we can display the cumulative shares of the users having this event at each step. The corresponding row names start with ACC_ prefix. There are two options for displaying these rows:
accumulated='only'display rows with accumulated values only;accumulated='both'display rows with both accumulated and not accumulated values.
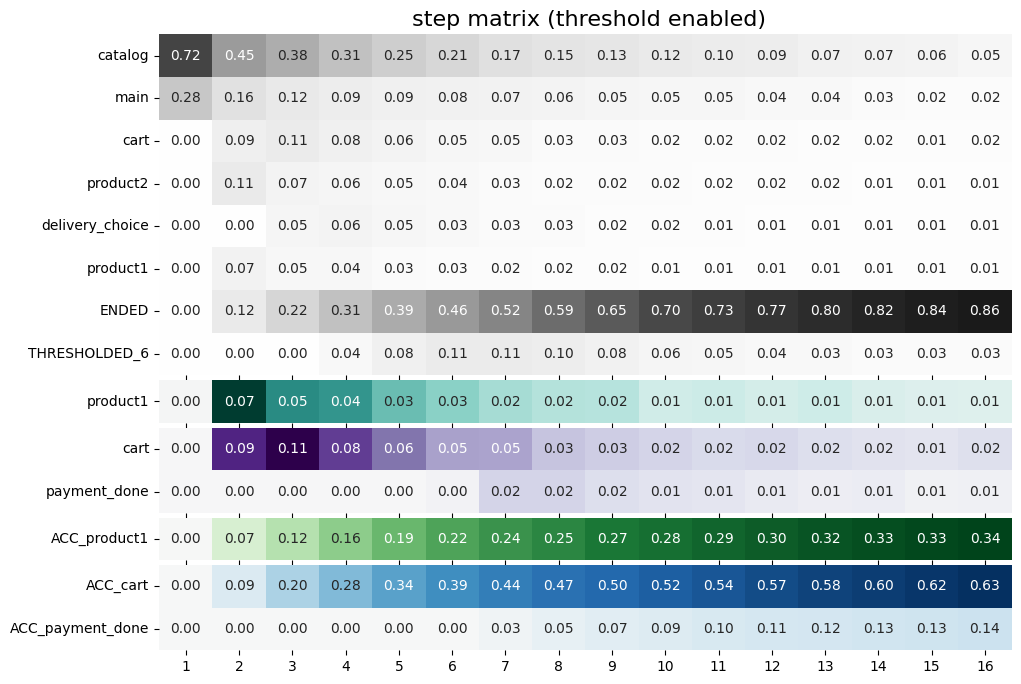
The step matrix below demonstrates accumulated='only' option:
stream.step_matrix(
    max_steps=16,
    threshold=0.05,
    targets=['product1', ['cart', 'payment_done']],
    accumulated='only'
)

In comparison with the previous step matrix, at the bottom we see three rows ACC_product1, ACC_cart, ACC_payment_done instead of product1, cart, and payment_done. Now, let us show how accumulated='both' option works.
stream.step_matrix(
    max_steps=16,
    threshold=0.05,
    targets=['product1', ['cart', 'payment_done']],
    accumulated='both'
)
Above, we see two target blocks: one is with accumulated values, another one with the original values.
Centered step matrix#
Sometimes we are interested in the flow of users through a specific event to answer such questions as how do users reach a specific event and what do they do afterwards? This information can be visualized with the centered parameter:
stream.step_matrix(
    max_steps=16,
    threshold=0.2,
    centered={
        'event': 'cart',
        'left_gap': 5,
        'occurrence': 1
    }
)
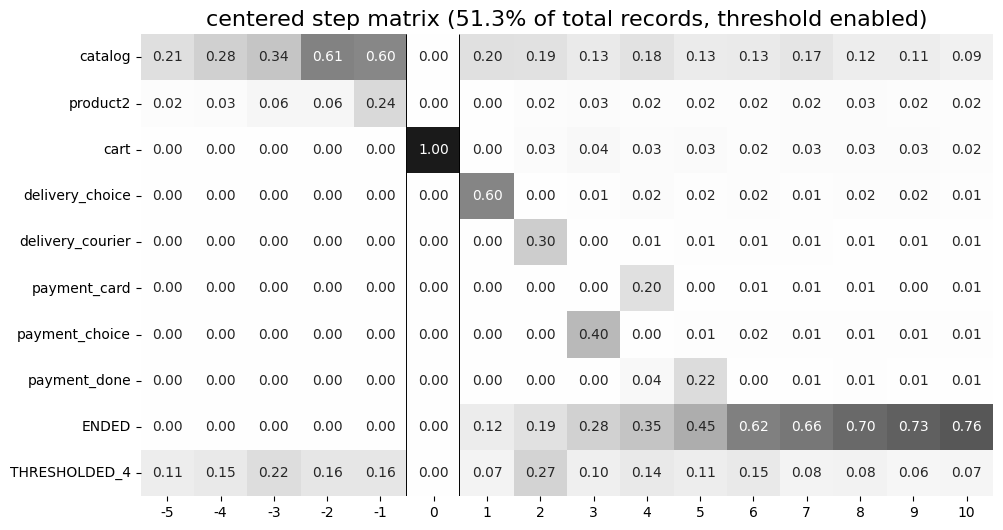
The centered parameter is a dictionary that requires three keys:
event: name of the event we focus on. Reaching this event is associated with step 0. Negative step numbers correspond to the events occurred before the selected event. Positive step numbers correspond to the events occurred after the selected event;left_gap: integer number that indicates how many steps before the centered event we want to show in the step matrix;occurrence: the occurrence number of the target event to trigger thecenteredparameter. For example, in the coding example above, all the trajectories will be aligned to have the firstcartoccurrence as step 0.
Importantly, when the centered parameter is used, only the users who have centered['event'] occurred at list centered['occurrence'] times are considered. The share of such users with respect to all the users from the eventstream is represented in the diagram’s title. In the example above, 51.3% of the users reached the event cart at least once.
Another property of step matrix is that at step 0 column we always have zeros at any row except the row that relates to the centering event: at that row there is always 1.
To better understand the meaning of the occurrence parameter, let us calculate another step matrix. This time with occurrence=2:
stream.step_matrix(
    max_steps=16,
    threshold=0.2,
    centered={
        'event': 'cart',
        'left_gap': 5,
        'occurrence': 2
    }
)
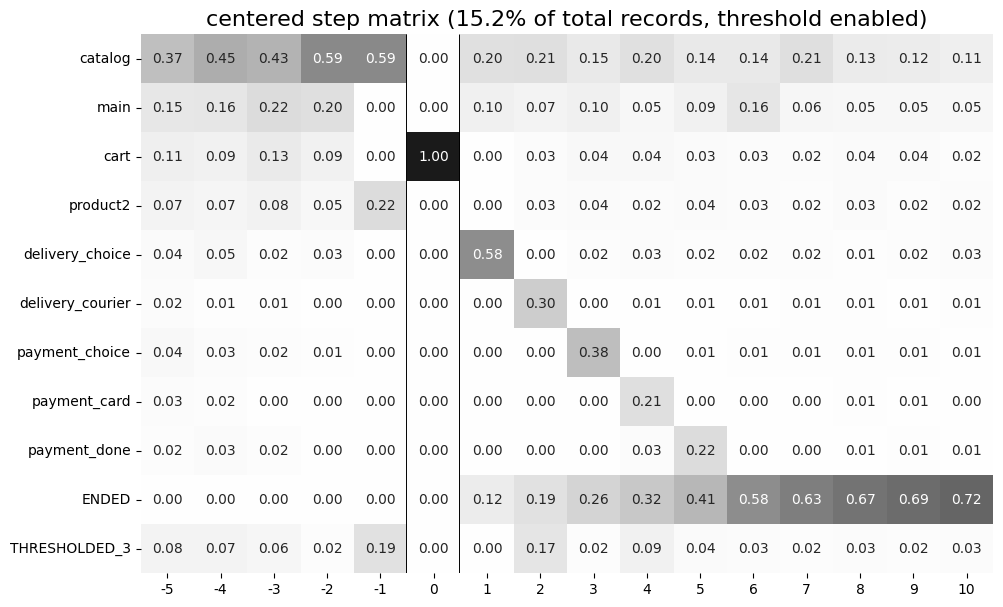
Here we can see that the proportion of the users whose steps are considered in our matrix has noticeably decreased. Now it is 15.2%, because we are evaluating the second occurrence of the cart event, which
means we are considering the users who had this event at least twice.
A combination of targets and centered parameters is also possible:
stream.step_matrix(
    max_steps=16,
    threshold=0.2,
    centered={
        'event': 'cart',
        'left_gap': 5,
        'occurrence': 1
    },
    targets=['payment_done']
)
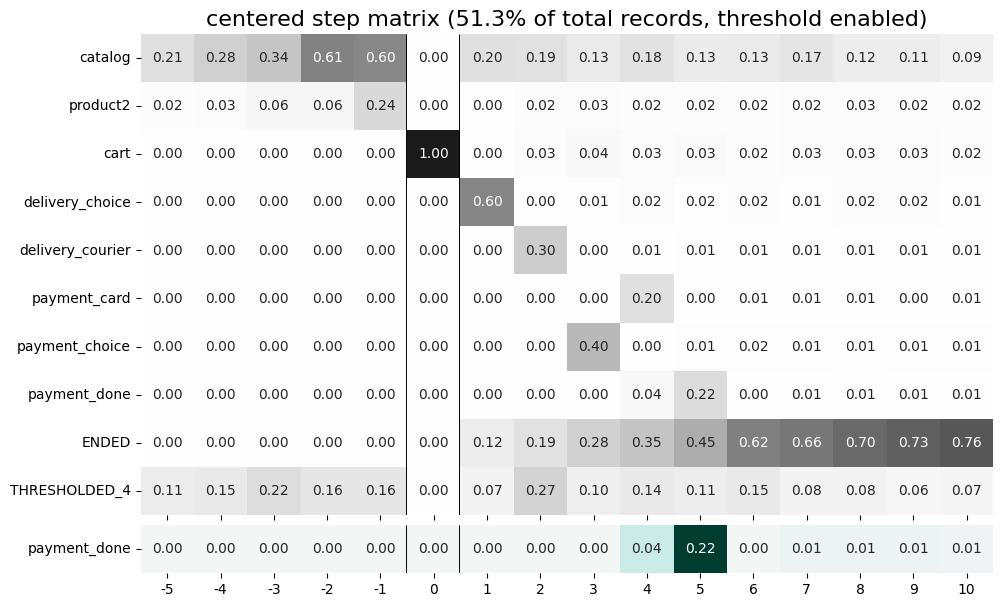
From the step matrix above, we see that the maximum in the target row appear at step 5 (with the value of 0.22). We can interpret this as follows: if a user reaches the cart event and makes a purchase afterwards, it is likely that it took them 5 steps.
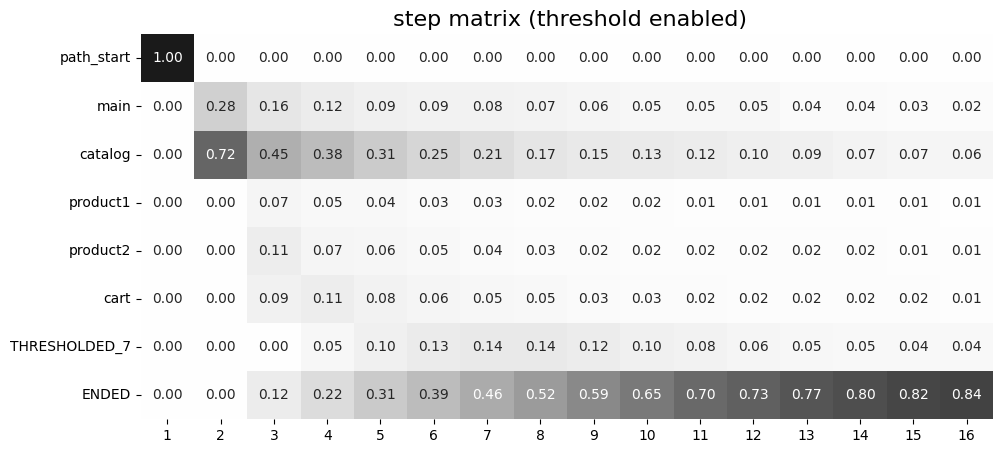
Events sorting#
By default, rows of the step matrix are sorted in the following order:
Original events by the order of their first appearance in the eventstream;
ENDEDevent;THRESHOLDEDevents;target events.
Sometimes, it is needed to obtain a step matrix with events ranked in a specific order - for example, when you compare two step matrices. This can be done with the sorting parameter that accepts a list of event names in the required order to show up in the step matrix. Here is an example:
stream.step_matrix(max_steps=16, threshold=0.07)
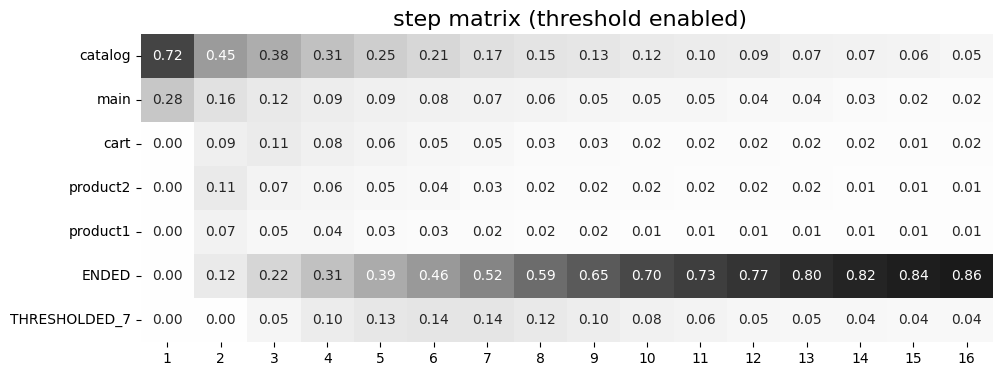
We pass the following list ofr the events to the sorting parameter:
custom_order = [
    'path_start',
    'main',
    'catalog',
    'product1',
    'product2',
    'cart',
    'THRESHOLDED_7',
    'ENDED'
]

stream.step_matrix(
    max_steps=16,
    threshold=0.07,
    sorting=custom_order
)
Note
It is convenient to modify the order of the event list with the help of StepMatrix.values property. See here for the details.
Note
The custom ordering affects non-target events only. Target events are always located at the bottom, and they are sorted in same order as they are specified in the targets parameter.
Differential step matrix#
Definition and general usage#
Sometimes we would like to compare behaviors of multiple groups of users - for example, the users who had a target event versus those who had not, or test and control groups in an A/B test.
Suppose we have two abstract groups of the users: g1 and g2. Let g1 consists of the users who had the payment_done event, and g2 - who had not. Suppose also that M1 and M2 are the step matrices that calculated for the groups g1 and g2 correspondingly. So we want to compare behaviours of the users from g1 and g2 groups. In this case, it is reasonable to calculate a new step matrix as difference between M1 and M2.
groups parameter is responsible for differential step matrix plotting. It requires a collection of two user lists related to two user groups. Each list should be represented as a collection of user ids.
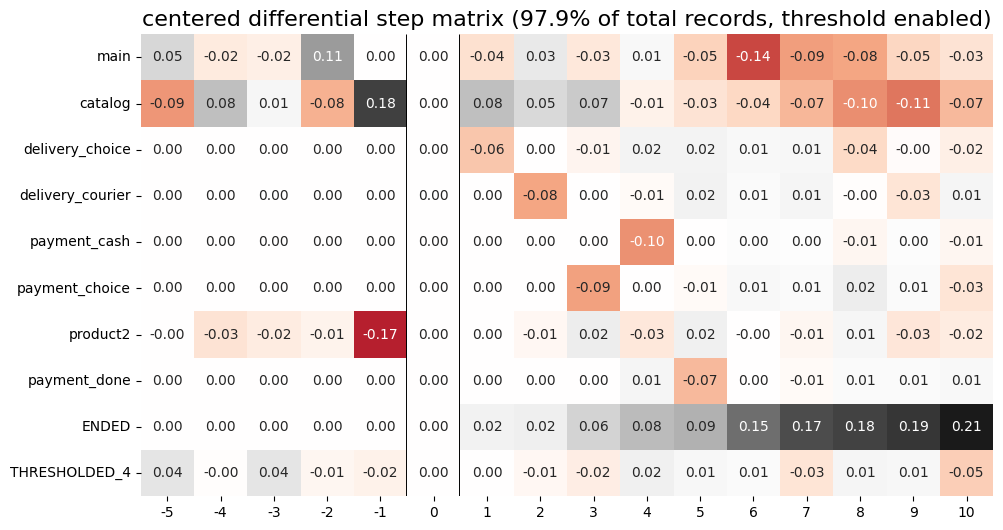
In the example below we demonstrate how the groups parameter works. We also choose cart as a central event, because usually it is closely followed by a purchase or user disappearance.
stream_df = stream.to_dataframe()

g1 = set(stream_df[stream_df['event'] == 'payment_done']['user_id'])
g2 = set(stream_df['user_id']) - g1

stream.step_matrix(
    max_steps=16,
    threshold=0.05,
    centered={
        'event': 'cart',
        'left_gap': 5,
        'occurrence': 1
    },
    groups=(g1, g2)
)
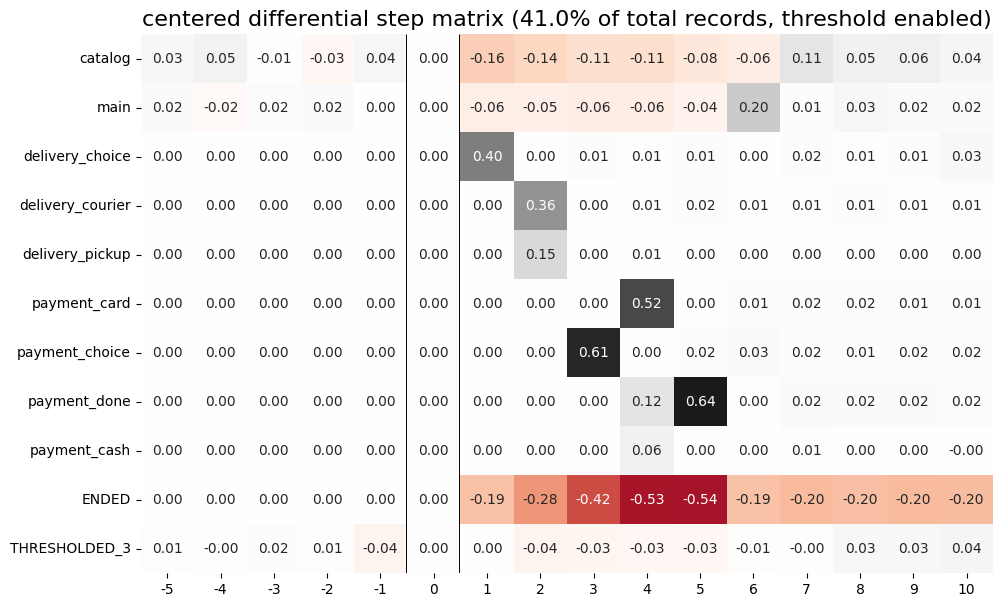
According to the step matrix definition, the values that are close to 0 mean that the corresponding values in the original matrices M1 and M2 are roughly equal. Large positive/negative value indicates that the corresponding value in M1 matrix is much greater/less than the corresponding number in M2 matrix. As a result, the step matrix heatmap highlights the cells where the difference is big.
For example, from the step matrix above we see that the values to the left from the central event cart are close to zero. It means that the behavior of users in the two groups is roughly the same. However, to the right of the cart event large positive and negative values appear. The positive values relate to such events as payment_done, payment_choice, or payment_choice. The users from g2 must have no payment_done event at all due to the group definition. As for the last two mentioned events, they relate to the payment process, so it is not a surprise that the users from the g2 experiences these events group less often than the users from g1 group.
Note that the values in each column of a differential step matrix are always sum up to 0, since the columns in both M1 and M2 matrices always sum up to 1. That is its fundamental property.
Cluster analysis#
Consider another example of differential step matrix usage. Now we will compare behaviors within two user clusters which are obtained by applying the Clusters tool. As before, we focus the analysis on payment_done and event cart events.
from retentioneering.tooling.clusters import Clusters

clusters = Clusters(eventstream=stream)
features = clusters.extract_features(feature_type='count', ngram_range=(1, 1))
clusters.fit(method='kmeans', n_clusters=8, X=features, random_state=42)
clusters.plot(targets=['payment_done', 'cart']);
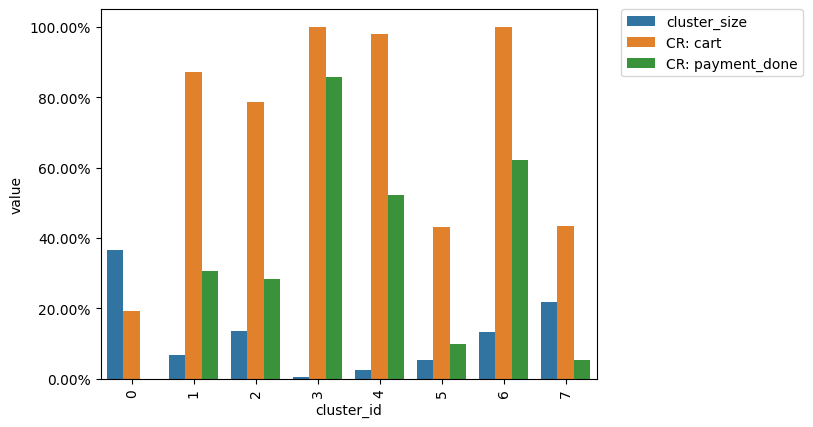
So we have defined 8 clusters. The diagram above shows the distribution of the conversion rate to the target events (payment_done and cart) among the clusters. Suppose we are interested in how clusters #1 and #3 differ.
All we need is to get user_id collections from the cluster_mapping attribute and pass it to the groups parameter of step matrix:
g1 = clusters.cluster_mapping[1]
g2 = clusters.cluster_mapping[4]

stream.step_matrix(
    max_steps=16,
    threshold=0.05,
    centered={
        'event': 'cart',
        'left_gap': 5,
        'occurrence': 1
    },
    groups=(g1,g2)
)
The differential step matrix shows the difference between clusters #1 and #4. Users from cluster #1, after adding a product to the cart tend to return to the catalog and continue shopping more often or, on the opposite, finish their trajectory. On the other hand, users from cluster #4 tend to fall into payment flow and eventually make purchase. They can also return to the catalog, but in later steps.
Weighting step matrix values#
So far, we have been defining step matrix values as the shares of users appearing in an eventstream at a certain step. However, sometimes it is reasonable to calculate similar fractions not over users, but over some other entities as well - typically, over user sessions.
To demonstrate how to do this, we need to split the eventstream into the sessions at first with the help of SplitSessions data processor. Let session timeout be 30 minutes.
stream_with_sessions = stream.split_sessions((30, 'm'))
Step matrix shares the same mechanism of weighting that is used in transition graph. weight_col parameter accepts a name of the weighting column in the eventstream. In our case, we pass session_id value.
stream_with_sessions.step_matrix(max_steps=16, weight_col='session_id', threshold=0)
For example, cart value at step 3 is 0.05 which means that at step 3 only 5% of the sessions had cart event.
Let us compare the result with the user-weighted matrix:
stream_with_sessions.step_matrix(max_steps=16, weight_col='user_id', threshold=0))
Now, we can see the difference between these two types of weighting. The number of unique sessions is greater than the number of unique users, so the proportion of the cart event at the third step when
normalizing by users is higher than for sessions (0.09 vs 0.05).
Using a separate instance#
By design, Eventstream.step_matrix() is a shortcut method that uses StepMatrix class under the hood. This method creates an instance of StepMatrix class and embeds it into the eventstream object. Eventually, Eventstream.step_matrix() returns exactly this instance.
Sometimes it is reasonable to work with a separate instance of StepMatrix class. An alternative way to get the same visualization that Eventstream.step_matrix() produces is to call StepMatrix.fit() and StepMatrix.plot() methods explicitly.
Here is an example how you can manage it:
from retentioneering.tooling.step_matrix import StepMatrix

step_matrix = StepMatrix(stream)
step_matrix.fit(max_steps=12, targets=['payment_done'], threshold=0)
step_matrix.plot()
Common tooling properties#
values#
StepMatrix.values property returns the values underlying recent StepMatrix.plot() call. The property is common for many retentioneering tools. It allows you to avoid unnecessary calculations if the tool object has already been fitted.
Two pandas.DataFrame objects are returned: one for the step matrix, another one for the additional targets block.
stream.step_matrix(
    max_steps=6,
    targets=['product1', ['cart', 'payment_done']],
    threshold=0,
    show_plot=False
).values[0]
| 1 | 2 | 3 | 4 | 5 | 6 | |
|---|---|---|---|---|---|---|
| catalog | 0.716076 | 0.445215 | 0.384164 | 0.310051 | 0.251400 | 0.211677 |
| main | 0.283924 | 0.162357 | 0.121834 | 0.094108 | 0.085311 | 0.079712 |
| cart | 0.000000 | 0.089843 | 0.109571 | 0.080778 | 0.064783 | 0.047454 |
| delivery_choice | 0.000000 | 0.000000 | 0.054119 | 0.061584 | 0.049054 | 0.034391 |
| payment_choice | 0.000000 | 0.000000 | 0.000000 | 0.000000 | 0.033591 | 0.043455 |
| product1 | 0.000000 | 0.070115 | 0.045055 | 0.042655 | 0.031991 | 0.025860 |
| payment_done | 0.000000 | 0.000000 | 0.000000 | 0.000000 | 0.000000 | 0.003999 |
| payment_card | 0.000000 | 0.000000 | 0.000000 | 0.000000 | 0.000000 | 0.017595 |
| delivery_pickup | 0.000000 | 0.000000 | 0.000000 | 0.014396 | 0.016796 | 0.015463 |
| delivery_courier | 0.000000 | 0.000000 | 0.000000 | 0.025327 | 0.032791 | 0.024793 |
| payment_cash | 0.000000 | 0.000000 | 0.000000 | 0.000000 | 0.000000 | 0.004799 |
| product2 | 0.000000 | 0.114370 | 0.065849 | 0.057851 | 0.045854 | 0.035724 |
| ENDED | 0.000000 | 0.118102 | 0.219408 | 0.313250 | 0.388430 | 0.455079 |
stream.step_matrix(
    max_steps=6,
    targets=['product1', ['cart', 'payment_done']],
    threshold=0,
    show_plot=False
).values[1]
| 1 | 2 | 3 | 4 | 5 | 6 | |
|---|---|---|---|---|---|---|
| product1 | 0.0 | 0.070115 | 0.045055 | 0.042655 | 0.031991 | 0.025860 |
| cart | 0.0 | 0.089843 | 0.109571 | 0.080778 | 0.064783 | 0.047454 |
| payment_done | 0.0 | 0.000000 | 0.000000 | 0.000000 | 0.000000 | 0.003999 |
params#
StepMatrix.params property returns the StepMatrix parameters that was used in the last StepMatrix.fit() call.
stream.step_matrix(
    max_steps=6,
    targets=['product1', ['cart', 'payment_done']],
    threshold=0,
    show_plot=False
).params
{'max_steps': 6,
 'weight_col': 'user_id',
 'precision': 2,
 'targets': ['product1', ['cart', 'payment_done']],
 'accumulated': None,
 'sorting': None,
 'threshold': 0,
 'centered': None,
 'groups': None}