Transition Graph#
![]()

Loading data#
Throughout this guide we use our demonstration simple_shop dataset. It has already been converted to Eventstream and assigned to stream variable. If you want to use your own dataset, upload it following this instruction.
from retentioneering import datasets

stream = datasets.load_simple_shop()
A basic example#
The transition graph is a weighted directed graph that illustrates how often the users from an eventstream move from one event to another. The nodes stand for the unique events. A pair of nodes (say, A and B) is connected with a directed edge if the transition A → B appeared at least once in the eventstream. Transition means that event B appeared in a user path right after event B. For example, in path A, C, B there is no transition A → B since event C stands between A and B.
Each node and edge is associated with its weight. Roughly speaking, the weights are the numbers that reflect a node or an edge frequency. They might be calculated in multiple ways (see Weights section).
The primary way to build a transition graph is to call Eventstream.transition_graph() method:
stream.transition_graph()
According to the transition graph definition, we see here the events represented as nodes connected with the edges. By default, the nodes and edges weights are the number of unique users who experienced the corresponding event or transition. All the edges are labeled with these numbers in the graph. For example, among the others, we can see that there are 1324 unique users who had catalog → cart transitions, 603 users with main → main self-transitions, and there were none with product1 → payment_done transitions. The thickness of the edges and the size of the nodes are proportional to their weights.
The graph is interactive. You can move the nodes, zoom in/out the chart, and finally reveal or hide a control panel by clicking on the left edge of the chart. You can check the interactive features out even in the transition graphs embedded in this document.
Transition graph parameters#
Weights#
Edge weights calculation#
The edge weight values are controlled by edges_norm_type and edges_weight_col parameters of Eventstream.transition_graph() method.
Let us start from the explanation of the configuration edges_norm_type=None and edges_weight_col='event_id' which means that no normalization is needed and event_id column is used as a weighting column (we will explain the concept of weighting columns below). This combination defines edge weight as the number of the transitions associated with the edge in the entire eventstream.
By weight normalization we mean dividing the transition counts (calculated for edges_norm_type=None case) by some denominator, so we get rational weights instead of integer. Except None, two normalization types are possible: full and node. Full normalization defines the denominator as the overall number of the transitions in the eventstream. Node normalization works as follows. Consider a hypothetical A → B transition. To normalize the weight of this edge we need to divide the number of A → B transitions by the total number of the transitions coming out of A node. In other words, node-normalized weight is essentially the probability of a user to transit to event B standing on event A.
Now, let us move to weighting column definition. In many cases it is reasonable to count the number of unique users or sessions instead of the number of transitions. This behavior is controlled by edges_norm_type parameter. By default, edges_weight_col='event_id' that is associated with the number of the transitions. You can also pass the names of the columns related to users or sessions in the eventstream. Typically they are user_id and session_id, but to be sure, check your eventstream data schema and session_col parameter in the SplitSessions data processor if you used it.
Having edges_weight_col defined allows you to calculate the weighs as the unique values represented in edges_weight_col column. This also relates to full and node normalization types. For example, edges_norm_type='full' and edges_weight_col='user_id' configuration means that we divide the number of the unique users who had a specific transition by the number of the unique users in the entire eventstream.
A simplified example#
In order to check whether you understand these definitions correctly, let us consider a simplified example and look into the matter of the edge weights calculation. Suppose we have the following eventstream:
user1: A, B, A, C, A, Buser2: A, B, C, C, C
user3: C, D, C, D, C, D
This eventstream consists of 3 unique users and 4 unique events. The event colors denote sessions (there are 6 sessions). We ignore the timestamps since the edge weights calculation does not take them into account. Note that throughout this example we will suppress edge_ prefix for the edges_norm_type and edges_weight_col.
Table 1 describes how the edge weights are calculated in case of weight_col='event_id'.
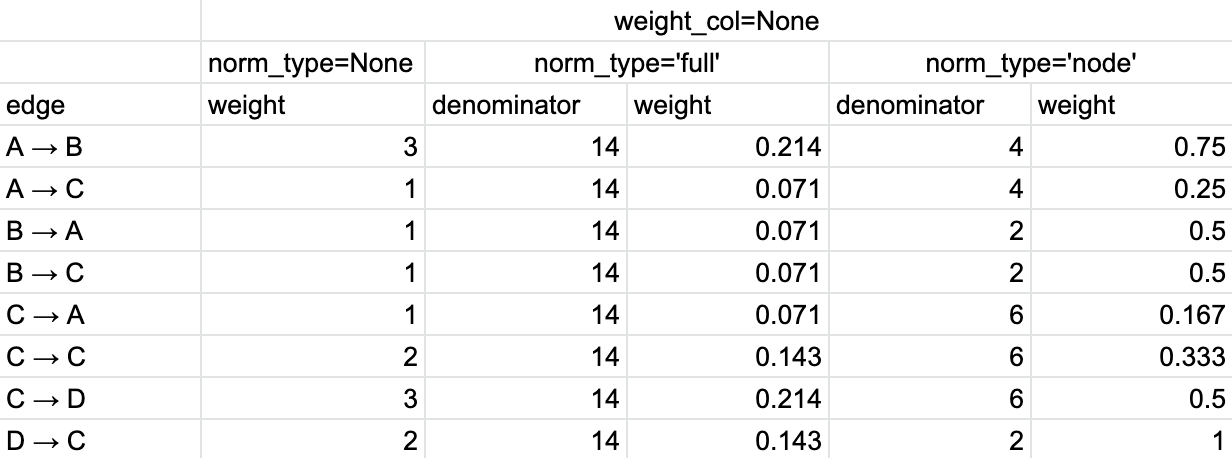
Table 1. The calculation of the edge weights for weight_col=’event_id’ and different normalization types.#
So we have 8 unique edges in total. At first, we calculate for each edge the total number of such transitions occurred in the eventstream. As a result, we get the values in norm_type=None column. Next, we estimate the total number of the transitions in the eventstream: 14. To get the weights in norm_type='full' column, we divide the weights in norm_type=None column by 14. Finally, we estimate that we have 4, 2, 6, 1 transitions starting from event A, B, C, and D correspondingly. Those are the denominators for norm_type='node' column. To calculate the weights for this option, we divide the values in norm_type=None by these denominators.
The calculation of the edge weights for weight_col='user_id' is described in Table 2.
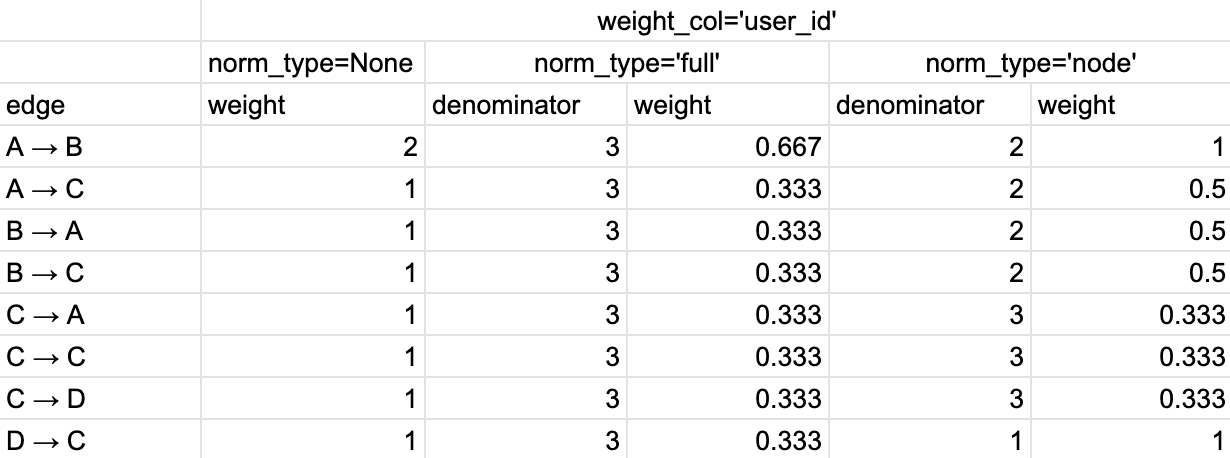
Table 2. The calculation of the edge weights for weight_col=’user_id’ and different normalization types.#
Now, for norm_type=None option we calculate the number of unique users who had a specific transition. For norm_type='full' the denominator is 3 as the total number of users in the eventstream. As for norm_type='node' option, we have 2, 2, 3, 1 unique users who experienced A → *, B → *, C → *, D → * transitions. These values comprise the denominators. Again, to get the weights in norm_type='column', we divide the values from norm_type=None column by these corresponding denominators.
Finally, in Table 3 we demonstrate the calculations for weight_col='session_id' .
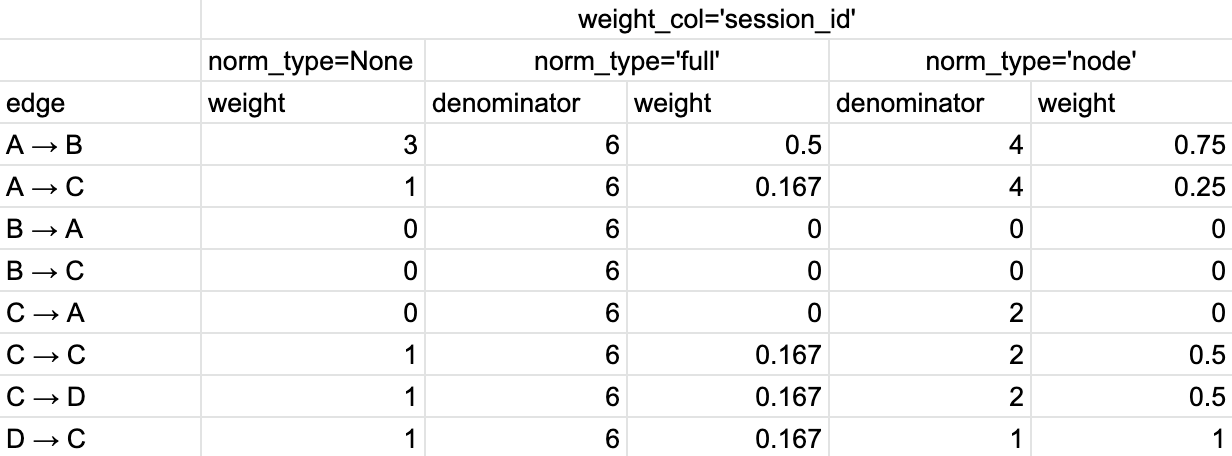
Table 3. The calculation of the edge weights for weight_col=’session_id’ and different normalization types.#
In comparison with the case for user_id weight column, there are some important differences. Transitions B → A, C → A, B → C are excluded since they are terminated by the session endings (their weights are zeros). As for the other transitions, we calculate the number of unique sessions they belong to. This is how we get norm_type=None column. The total number of the sessions in the eventstream is 6. This is the denominator for norm_type='full' column. The denominators for norm_type='node' column are calculated as the number of the unique sessions with A → *, B → *, C → *, and D → * transitions. They are 4, 0, 2, and 1 correspondingly. Note that for B → A and B → C edges we have indeterminate form 0/0, since we have excluded all the transitions starting from B. We define the corresponding weights as 0. Also, the denominator for C → * edges is 2, not 3 since we have excluded one C → A transition.
Node weights#
Besides edge weights, a transition graph also have node weights that control the diameters of the nodes. Unfortunately, so far only one option is supported: norm_type=None along with weighting columns. By default, weight_col='user_id'.
If you want to know how the node weights for norm_type='full' are calculated, expand the following text snippet:
Obviously, node weights do not support norm_type='node' since it involves edges by design. However, node_norm_type=None and norm_type='full' options might be calculated. They leverage the same calculation logic as we used for the edge weights calculation.
We explain this logic using the same example eventstream.
So for norm_type=None option the node weights are simply the counters of the events over the entire eventstream (in case of weight_col='event_id') or the number of unique users or sessions (in case of weight_col='user_id' or weight_col='session_id') that had a specific event. For norm_type='full' we divide the non-normalized weights by either the overall number of events (17), or the number of unique users (3), or the number of unique sessions (6). See the calculations for each of the described cases in Table 4, Table 5, and Table 6 below:
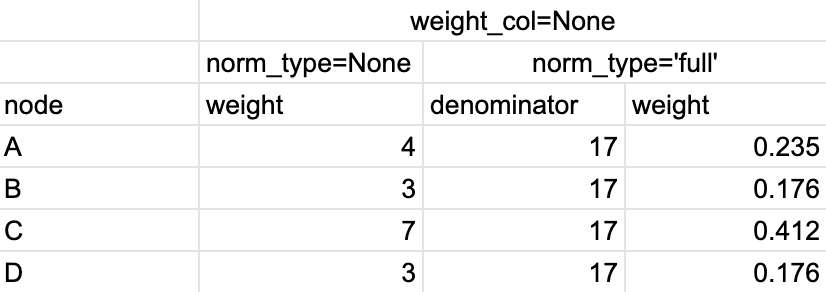
Table 4. The calculation of the node weights for weight_col=’event_id’ and different normalization types.#
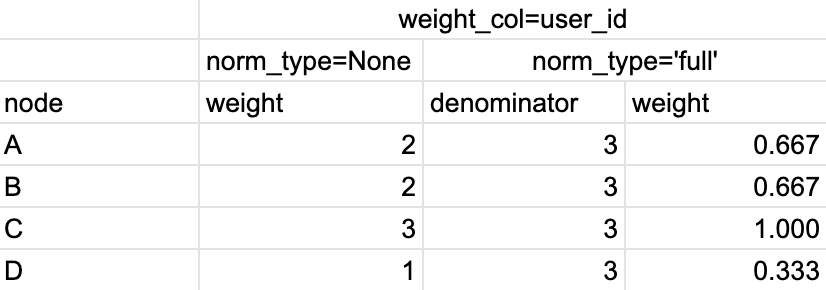
Table 5. The calculation of the node weights for weight_col=’user_id’ and different normalization types.#
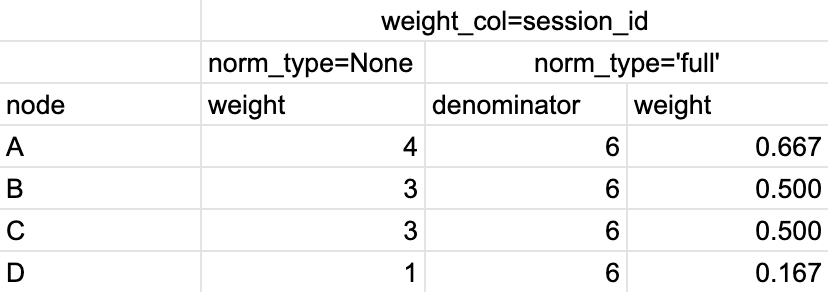
Table 6. The calculation of the node weights for weight_col=’session_id’ and different normalization types.#
Setting the weight options#
Finally, we demonstrate how to set the weighting options for a graph. As it has been discussed, edges_norm_type argument accepts None, full or node values. A weighting column is set by edges_weight_col argument. Below is a table that summarizes the definitions of edge weights when these two arguments are used jointly.
edges_norm_type → edges_weight_col ↓ |
None |
full |
node |
|---|---|---|---|
event_id |
The total number of the |
The total number of the |
The total number of the |
None or user_id |
The total number of the unique users who had the |
The total number of the unique users who had the |
The total number of the unique users who had the |
session_id |
The total number of the unique sessions who had the |
The total number of the unique sessions who had the |
The total number of the unique sessions where the |
Here is an example of the using these arguments:
stream.transition_graph(
    edges_norm_type='node',
    edges_weight_col='user_id'
)
From this graph we see, for example, that being at product1 event, 62.3% of the users transit to catalog event, 43.3% - to cart event, and 11.4% - to main event. As you can notice, when you use some normalization, the values are not necessarily sum up to 1. This happens because a user can be at product1 state multiple times, so they can jump to multiple of these three events.
Thresholds#
The weights that we have discussed above are associated with importance of the edges and the nodes. In practice, a transition graph often contains enormous number of the nodes and the edges. The threshold mechanism sets the minimal weights for nodes and edges to be displayed in the canvas.
Note that the thresholds may use their own weighting columns both for nodes and for edges independently of those weighting columns defined in edges_weight_col arguments. So the weights displayed on a graph might be different from the weights that the thresholds use in making their decision for hiding the nodes/edges. Moreover, multiple weighting columns might be used. In this case, the decision whether an item (a node or an edge) should be hidden is made applying logical OR: an item is hidden if it does not meet any threshold condition.
Also note that, by default, if all the edges connected to a node are hidden, the node becomes hidden as well. You can turn this option off here.
The thresholds are set with a couple of nodes_threshold, edges_threshold parameters. Each parameter is a dictionary. The keys are weighting column names, the values are the threshold values.
stream.transition_graph(
    edges_norm_type='node',
    edges_weight_col='user_id',
    edges_threshold={'user_id': 0.12},
    nodes_threshold={'event_id': 500}
)
This example is an extension of the previous one. We use the same normalization configuration as before. Since we have added an edges threshold of 0.12 for user_id weighting column, the edge product1 → main that we observed in the previous example is hidden now (its weight is 11.4%). As for the nodes threshold, note that event payment_cash is hidden now (as we can see from the Nodes block in the Control panel, its weight is 197).
Color settings#
As we have already mentioned, the graph nodes and edges are often of different importance. Sometimes we need not just to hide graph unimportant elements, but to highlight important ones instead. There are two ways to set colors of nodes and edges.
The first one is setting targets parameter. It associates given nodes with one of three target types and the corresponding colors: positive (green), negative (red), and source (orange). As a result, the nodes and all their income and outcome edges are colored. Below is an example of the targets usage.
stream\
    .transition_graph(
        targets={
            'positive': ['payment_done', 'cart'],
            'negative': 'path_end',
            'source': 'path_start'
        }
    )
The second option is to set a color for each node or edge explicitly. Use nodes_custom_colors and edges_custom_colors parameters for this. The colors may be set using standard HTML color names or with HEX codes. targets parameter is compatible in this case too.
nodes_custom_colors = {
    'product1': 'gold',
    'product2': 'gold',
    'cart': 'green'
}

edges_custom_colors = {
    ('path_start', 'catalog'): '#cc29c4',
    ('path_start', 'main'): '#cc29c4',
}

stream\
    .transition_graph(
        nodes_custom_colors=nodes_custom_colors,
        edges_custom_colors=edges_custom_colors,
        targets={'negative': 'path_end'}
    )
Graph settings#
You can set up the following boolean flags:
show_weights. Hide/display the edge weight labels. Default value is True.show_percents. Display edge weights as percents. Available only if an edge normalization type is chosen. Default value is False.show_nodes_names. Hide/display the node names. Default value is True.show_all_edges_for_targets. By default, the threshold filters hide the edges disregarding the node types. In case you have defined target nodes, you usually want to carefully analyze them. Hence, all the edges connected to these nodes are important. This displaying option allows to ignore the threshold filters and always display any edge connected to a target node. Default value is True.show_nodes_without_links. Setting a threshold filter might remove all the edges connected to a node. Such isolated nodes might be considered as useless. This displaying option hides them in the canvas as well. Default value is True.show_edge_info_on_hover. By default, a tooltip with an edge info pops up when you mouse over the edge. It might be disturbing for large graphs, so this option suppresses the tooltips. Default value is False.
These flags could be specified as separate arguments as follows:
stream.transition_graph(
    edges_norm_type='node',
    show_weights=True,
    show_percents=True,
    show_nodes_names=True,
    show_all_edges_for_targets=False,
    show_nodes_without_links=False,
    show_edge_info_on_hover=True
)
Control panel#
The control panel is a visual interface allowing you to interactively control transition graph behavior. It also allows even to control the underlying eventstream in some scenarios (grouping events, renaming events, including/excluding events).
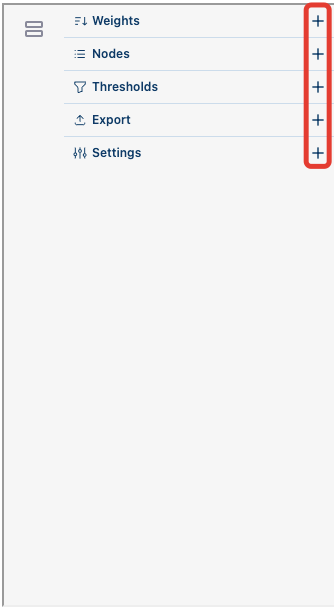
The control panel consists of 5 blocks: Weights, Nodes, Thresholds, Export, and Settings. By default, all these blocks are expanded. You can collapse them by clicking minus sign located at the top right corner of each block.
|
|
|---|---|
Click the minus sign to collapse the blocks. |
Click the plus sign to expand the blocks. |
Warning
All the settings that are tweaked in the Control panel are available only in scope of the current transition graph displayed in the current Jupyter cell. As soon as you run Eventstream.transition_graph() again, all the settings will be reset to the defaults unless you call the method with particular parameters.
Weights block#
The Weights block contains selectors that choose weighting columns separately for nodes and edges. Unfortunately, so far you can not choose normalization type in this interface. The only way to set the normalization type is using edge_norm_type argument in Eventstream.transition_graph() method as it has been shown here. event_id weighting column refers to edge_norm_type=None.
For the nodes only event_id and user_id weighting columns are available. The same columns are available for the edges, but additionally the columns that are passed as the edges_weight_col and custom_weight_cols arguments of the Eventstream.transition_graph() are also available.
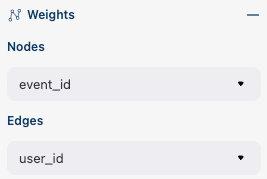
Weighting columns dropdown menu in the Weights block.#
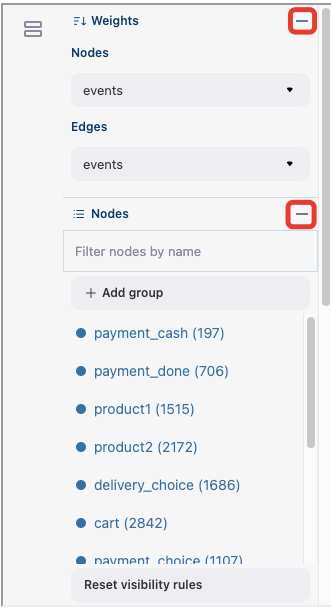
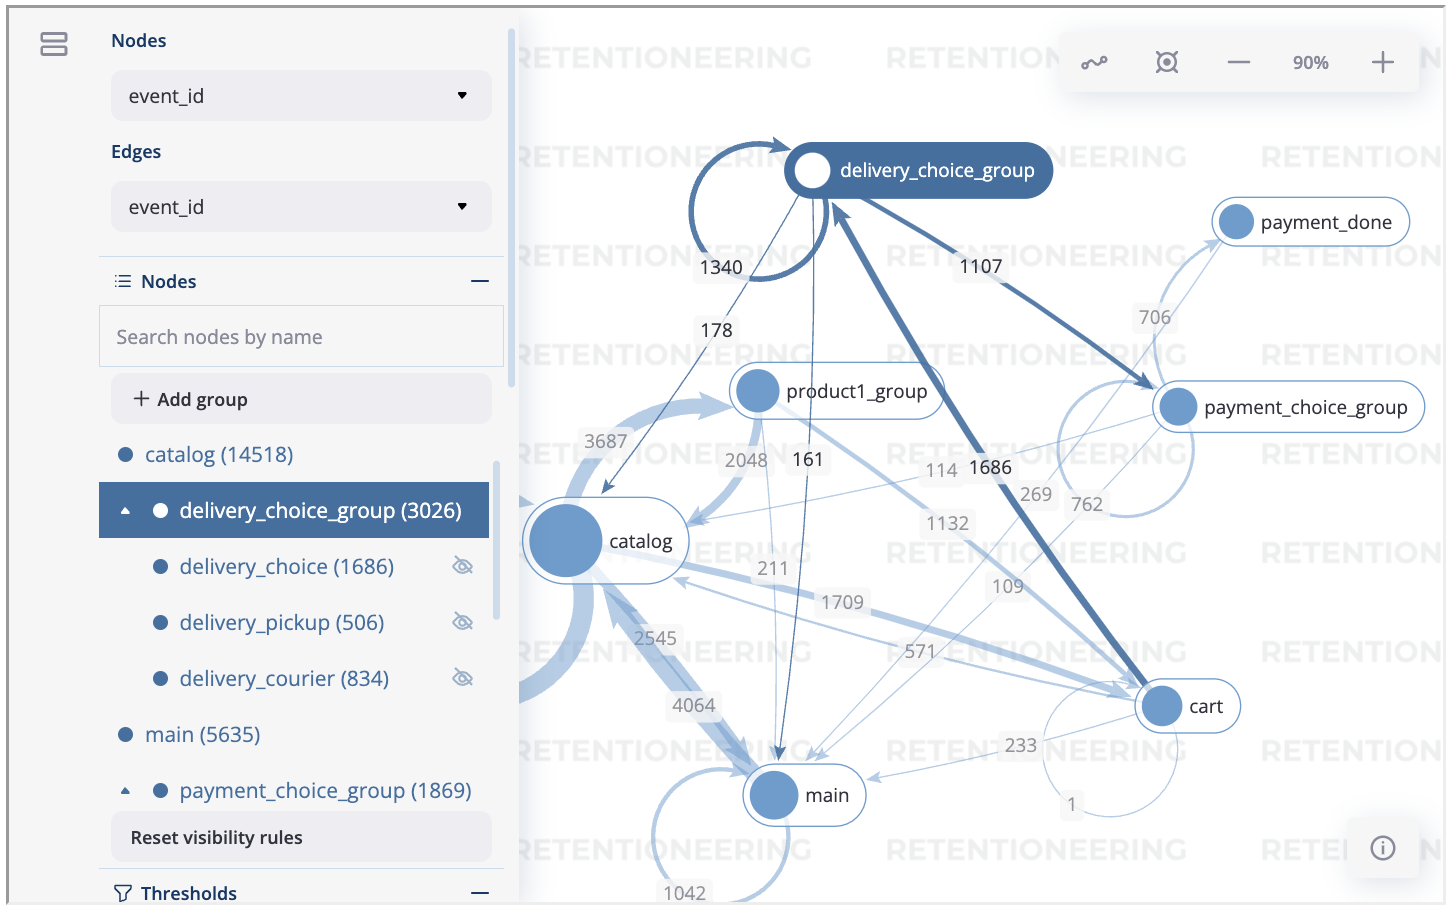
Nodes block#
The Nodes block enumerates all the unique events represented in the transition graph and allows to perform such operations as grouping, renaming, and switching events.
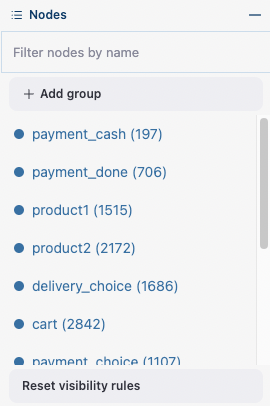
The Nodes block.#
Note
Nodes switcher requires graph recalculation.
Node item actions#
Each node list item contains the following 4 elements:
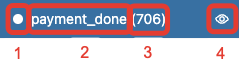
The elements of the node list.#
Focus icon. If you click it, the graph changes its position in the canvas so the selected node is placed in the center.
Event name. Double click it if you want to rename the node.
The number of the event occurrences in the eventstream.
This switcher hides the node and all the edges connected to the node from the canvas.
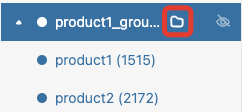
Grouping events#
The Control panel interface supports easy and intuitive event grouping. Suppose you want to group product1 and product2 events into one. There are two ways to do this:
Drag & drop method. Drag one node (say,
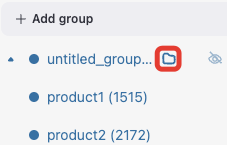
product2) and drop it toproduct1node.product1_groupevent appears which contains eventsproduct1andproduct2.Add group method. Click “+ Add group” button,
untitled_groupappears. Drag & drop all the nodes to be grouped to this group.
Grouping node has a folder icon that triggers aggregation action. Once you click it, the grouped nodes are merged and the changes are displayed in the transition graph. Recalculation is required to update the node and edge weights.
Note
By recalculation we mean that some additional calculations are required in the backend in order to display the graph state according to the selected options. To recalculate the values, click yellow ⚠️ icon and request the recalculation. Sometimes it is reasonable to do multiple modifications in the control panel, and then call the recalculation at once.
|
|
|---|---|
Grouping nodes using drag & drop method. |
Grouping nodes using + Add group method. |
To rename a grouping node, double click its name and enter a new one. To ungroup the grouped nodes drag & drop the nodes out of the grouping node (or drop it right on the grouping node). As soon as the last event is out, the grouping node disappears.
Note
All the grouping and renaming actions do not affect the initial eventstream due to eventstream immutability property. However, it is possible to export the modified eventstream using the TransitionGraph.recalculation_result attribute.
Thresholds block#
The Thresholds block contains two sliders: one is associated with the nodes, another one - with the edges. You can set up a threshold value either by moving a slider or by entering a value explicitly. Also, you can set up a weighting column for each slider independently of the weighting column defined in the Weights block (we have already mentioned this feature here). A single slider is shared between multiple weighting columns. As soon as you select a weighting column in the dropdown menu, the threshold slider attaches to it. If you change another weighting column, the slider saves the previously entered threshold value and associate it with the previous weighting column.
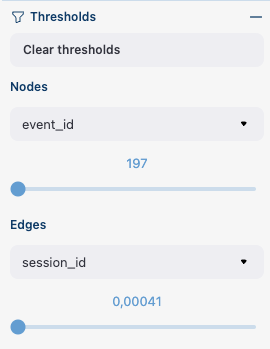
The Thresholds block.#
Normalization type block#
Along with the Weights block, the Normalization type block carries the information on the nodes and edges weights. However, so far this block does not allow to change the normalization type.
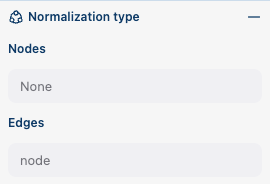
The Normalization type block.#
Export block#
Transition graph export supports four formats: HTML, JSON, SVG, and PNG.
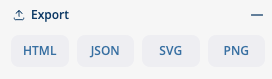
The Export block.#
PNG is a general-purpose format. It is used when you need to save a graph as an image.
HTML format is useful when you want to embed the resulting graph into different environments, reports, etc. Such a file supports all the interactive actions as if you treated the graph in Jupyter environment. For example, the graphs that are embedded in this user guide were exported right in this way, so that they are still interactive.
JSON format might be useful when you need to get the nodes coordinates. However, it is important to note that when using this option, only the node coordinates are saved. Any other adjustments or modifications you made in the graph GUI, such as thresholds, weights, settings will be lost and not included in the JSON file. To get the modified state of the eventstream, use recalculation_result property.
SVG is a commonly used format for vector graphics.
Settings block#
The control panel also contains a block with checkbox interface for the already mentioned settings.
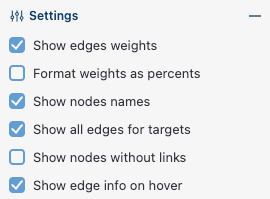
The Settings block.#
Import and export graph layout#
To restore previously saved node positions, you need to pass the file path of the JSON file to the layout_dump parameter.
path_to_file = '/path/to/node_params.json'
stream.transition_graph(layout_dump=path_to_file)
In general, layout dump mechanism is applied to the same eventstream that was a source of the JSON file. Technically, you can apply it to another eventstream. In this case, the saved node positions are assigned only for those nodes which are enlisted in the JSON file. Other nodes are ignored and placed at some default positions. This trick is convenient when you need to visualize transition graphs for multiple clusters of the same eventstream. You can use the same JSON file for all these graphs.
Note
In order to reproduce your graph state as closely as possible you can pass all the adjustments you have made in the transition graph GUI as parameters and their corresponding values to the new transition graph.
Graph properties#
A summary with all the important chosen graph settings is available by clicking ⓘ icon in the bottom right corner.
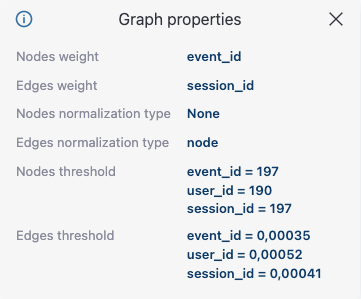
Graph properties.#
Saving the modified eventstream#
When you perform GUI actions that affect eventstream (like grouping events), the original eventstream is not changed.
To work with the updated data, you can export the modified eventstream using the TransitionGraph.recalculation_result property.
Suppose you have built a transition graph and obtained the following grouped events delivery_choice_group, payment_choice_group, product1_group.
tg = stream.transition_graph()
As we see from below, recalculation_result property contains these grouped events:
tg.recalculation_result.to_dataframe()
| event_id | event_type | event_index | event | timestamp | user_id | |
|---|---|---|---|---|---|---|
| 0 | c209a540-5bdf-45ef-84da-917b0751fb3f | raw | 0 | catalog | 2019-11-01 17:59:13.273932 | 219483890 |
| 1 | ab361d87-ed46-45d1-950b-9e58c57a017c | raw | 1 | product1_group | 2019-11-01 17:59:28.459271 | 219483890 |
| 2 | fa45b90d-5c03-4d09-b977-5c8a3d2fc32f | raw | 2 | cart | 2019-11-01 17:59:29.502214 | 219483890 |
| 3 | 1b423d0c-a611-48d1-a20f-a264dd51b4b2 | raw | 3 | catalog | 2019-11-01 17:59:32.557029 | 219483890 |
| 4 | c0fcfaf6-2899-4f07-93e8-776a5147f8d4 | raw | 4 | catalog | 2019-11-01 21:38:19.283663 | 964964743 |
| 5 | bde282ab-5153-492e-83c1-8903ccf78a6b | raw | 5 | cart | 2019-11-01 21:38:36.761221 | 964964743 |
| 6 | 82c5197e-9a5e-4c16-b6be-92c3aa0c2c08 | raw | 6 | delivery_choice_group | 2019-11-01 21:38:37.564693 | 964964743 |
Transition matrix#
Transition matrix is a sub-part of transition graph. It contains edge weights only so that the weight of, say, A → B transition is located at A row and B column of the transition matrix. The calculation logic is exactly the same as we have described here for transition graphs, and the arguments are similar to weights-related arguments of transition graph. Use norm_type instead of edges_norm_type and weight_col instead of edges_weight_col.
stream.transition_matrix(norm_type='node', weight_col='user_id')
| cart | catalog | ... | payment_done | payment_cash | |
|---|---|---|---|---|---|
| cart | 0.000594 | 0.283848 | ... | 0.000000 | 0.0 |
| catalog | 0.418458 | 0.633375 | ... | 0.000000 | 0.0 |
| ... | ... | ... | ... | ... | ... |
| payment_done | 0.000000 | 0.000000 | ... | 0.000000 | 0.0 |
| payment_cash | 0.000000 | 0.000000 | ... | 0.708333 | 0.0 |
For example, from this matrix we can see that the weight of the edge cart → catalog is ~0.28 with respect to given weights configuration: norm_type='node' and weight_col='user_id'.
Using a separate instance#
By design, Eventstream.transition_graph() is a shortcut method that uses TransitionGraph class under the hood. This method creates an instance of TransitionGraph class and embeds it into the eventstream object. Eventually, Eventstream.transition_graph() returns exactly this instance.
Sometimes it is reasonable to work with a separate instance of TransitionGraph class. An alternative way to get the same visualization that Eventstream.transition_graph() produces is to call TransitionGraph.plot() method explicitly.
Here is an example how you can manage it:
from retentioneering.tooling.transition_graph import TransitionGraph

tg = TransitionGraph(stream)

tg.plot(
    edges_norm_type='node',
    edges_weight_col='user_id',
    edges_threshold={'user_id': 0.12},
    nodes_threshold={'event_id': 500},
    targets={'positive': ['payment_done', 'cart']}
)