Preprocessing graph#
![]()

The concept of preprocessing graph#
By preprocessing we mean any eventstream data transformation preceding applying analytical tools. This process is crucial for analytical research. Some analytical methods are sensitive to data they accept as input, so the data must be prepared in a special way. Another case when the preprocessing arises is when you want to explore some parts of an eventstream (instead of the entire eventstream) so you have to truncate the data in an efficient way. Finally, often you want to clean and wrangle the data in order to remove technical, misleading events or user paths entirely.
The Preprocessing module allows you to treat all the data preparations efficiently. The core element of this module is a data processor. This document does not cover the details on how each data processor works, so if you have not read data processors user guide so far, we recommend you to explore it.
Applying a single data processor in most cases is not enough for solving your practical preprocessing problem. In fact, preprocessing pipelines often involve multiple data processors, and requre complex splitting and merging logic. That is why it is natural to use graph structures to describe all these calculations. We introduce you to the preprocessing graph - an object which organises preprocessing calculations.
The idea of preprocessing graph is simple. Each node of the graph is a single data processor. The nodes are linked according to the sequential order of the calculations. The graph root is associated with the original state of an eventstream. On the other hand, any graph node may be considered as a specific state of the original eventstream. This state is comprehensively described by the sequence of data processors we apply following the graph path from the root to this specific node.
Note that a preprocessing graph just frames the calculation logic. To get an eventstream state corresponding to a specific graph node, we need to run the calculation explicitly. See Running the calculation section for the details.
Case study#
Problem statement#
The best way to explain the variety of the preprocessing features that retentioneering offers is to consider a case study. We will construct a preprocessing graph using our demonstration simple_shop dataset, which we load as an Eventstream object. You can learn more about Eventstream in our eventstream guide.
import pandas as pd
from retentioneering import datasets

stream = datasets.load_simple_shop()
Suppose we want to transform the initial eventstream in the following way:
Add
path_startandpath_endevents.Group
product1andproduct2events into singleproductevent;Among the users who are not identified as new, we want to remove those trajectories which are considered as truncated;
Split the paths into the sessions.
The idea behind this case is that we want to demonstrate not only “linear” preprocessing actions (i.e. the calculations which are executed step-by-step, with no branching logic required), but to show more complex branching and merging preprocessing logic as well.
A draft of a solution#
Data processors are bricks for our preprocessing. So we have to represent our solution as a combination of the data processors.
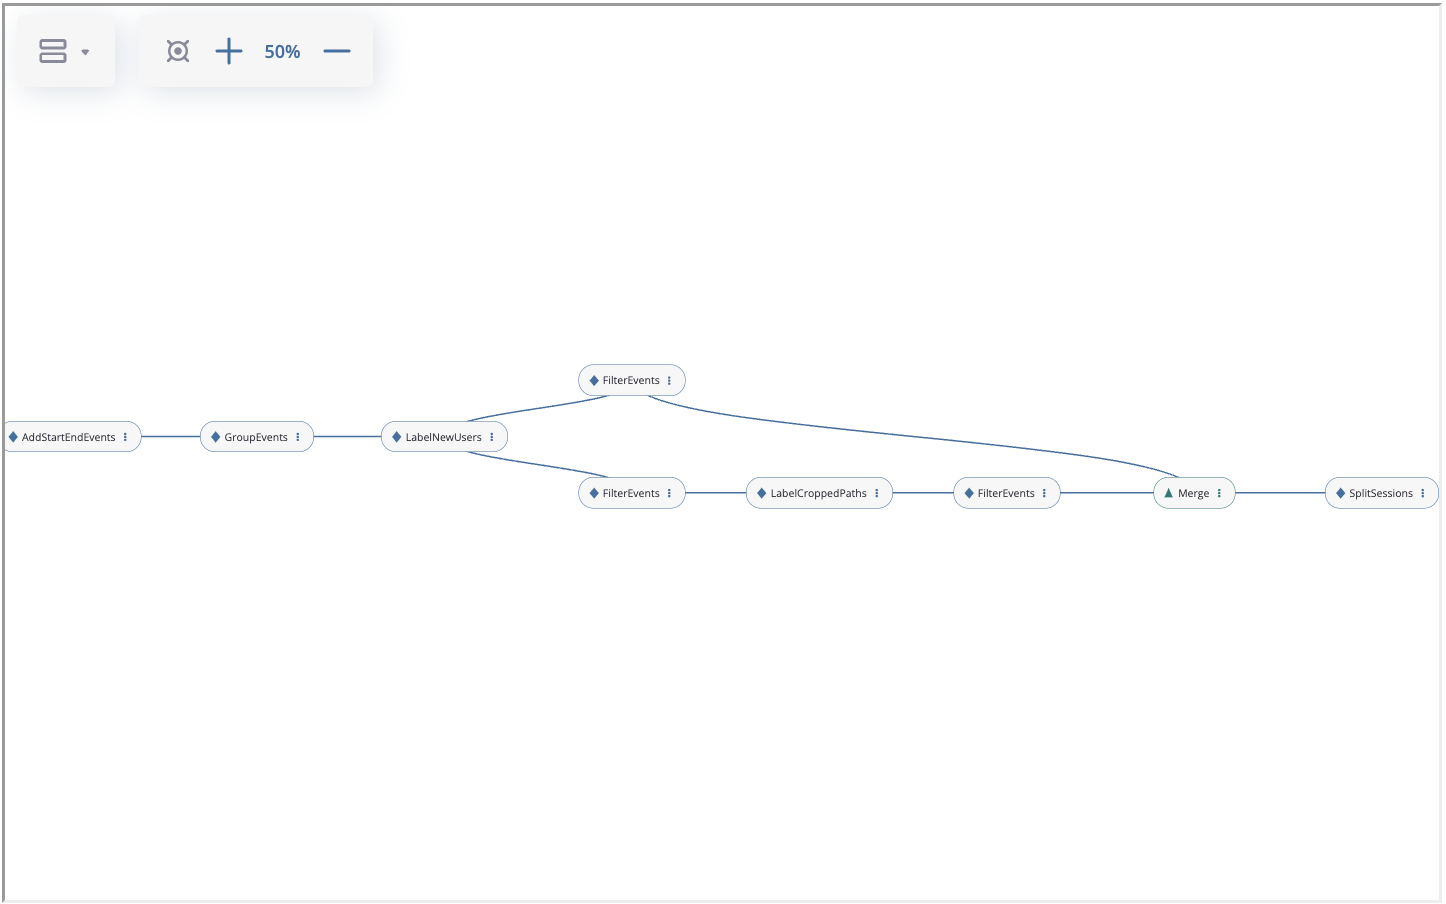
As for requirements 1, 2, and 4 of the case study, they are straightforward. Each of them relates to a single data processor application. In contrast, requirement 3 is a bit tricky. First, we need to apply the LabelNewUsers data processor, marking the trajectories with the new_user and existing_user markers. Next, we apply the FilterEvents data processor twice: once to get the new users from the previous step, and then to get the existing users. Note that the preprocessing flow splits at this point. Next, for the branch related to the existing users we need to sequentially apply the LabelCroppedPaths data processor for marking the paths as truncated or not, and then another FilterEvents data processor to leave intact trajectories only. Finally, we need to merge the data from the two separated branches and apply the SplitSessions data processor in the end. An outline of the described solution is represented on the image below.
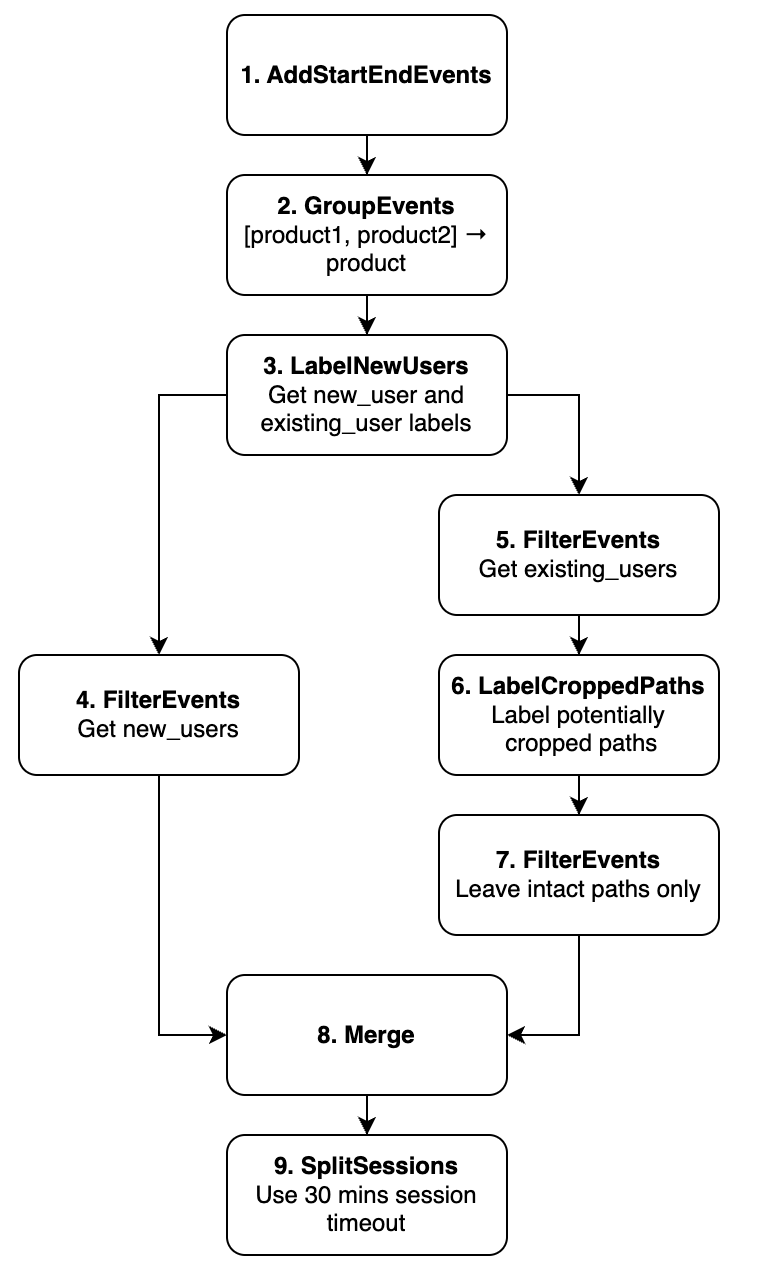
An outline of the possible case study solution.#
Pay attention to the splitting and merging logic. After the 3rd node the eventstream is split into the two disjoint eventstreams (one contains only new users, another contains only existing users). Once we finish processing the existing users’ trajectories we need to merge these two eventstreams. There’s a special merging node developed for this purpose. We’ll talk about it later in this user guide.
Next, we specify the information about the graph nodes and the underlying data processors. The table below contains the list of the nodes, the data processors they are associated with, and the particular parameters they need to be applied to them. We find this a bit more informative and we wil build the preprocessing graph according to this plan.
Node |
Data processor |
Parameters |
Parents |
|---|---|---|---|
node1 |
– |
Source |
|
node2 |
|
node1 |
|
node3 |
pass this csv-file to |
node2 |
|
node4 |
|
node3 |
|
node5 |
|
node3 |
|
node6 |
|
node5 |
|
node7 |
|
node6 |
|
node8 |
– |
node4, node7 |
|
node9 |
|
node8 |
The functions which are passed to func parameter in the FilterEvents and GroupEvents data processors will be defined below.
There are two ways to build a preprocessing graph: with the preprocessing GUI tool or with code. We start from the GUI and then move to the code-generated graphs in the next section.
Preprocessing GUI#
Preprocessing GUI tool allows to create preprocessing graphs using graphical interface. To display this tool, call the Eventstream.preprocessing_graph() method:
pgraph = stream.preprocessing_graph()
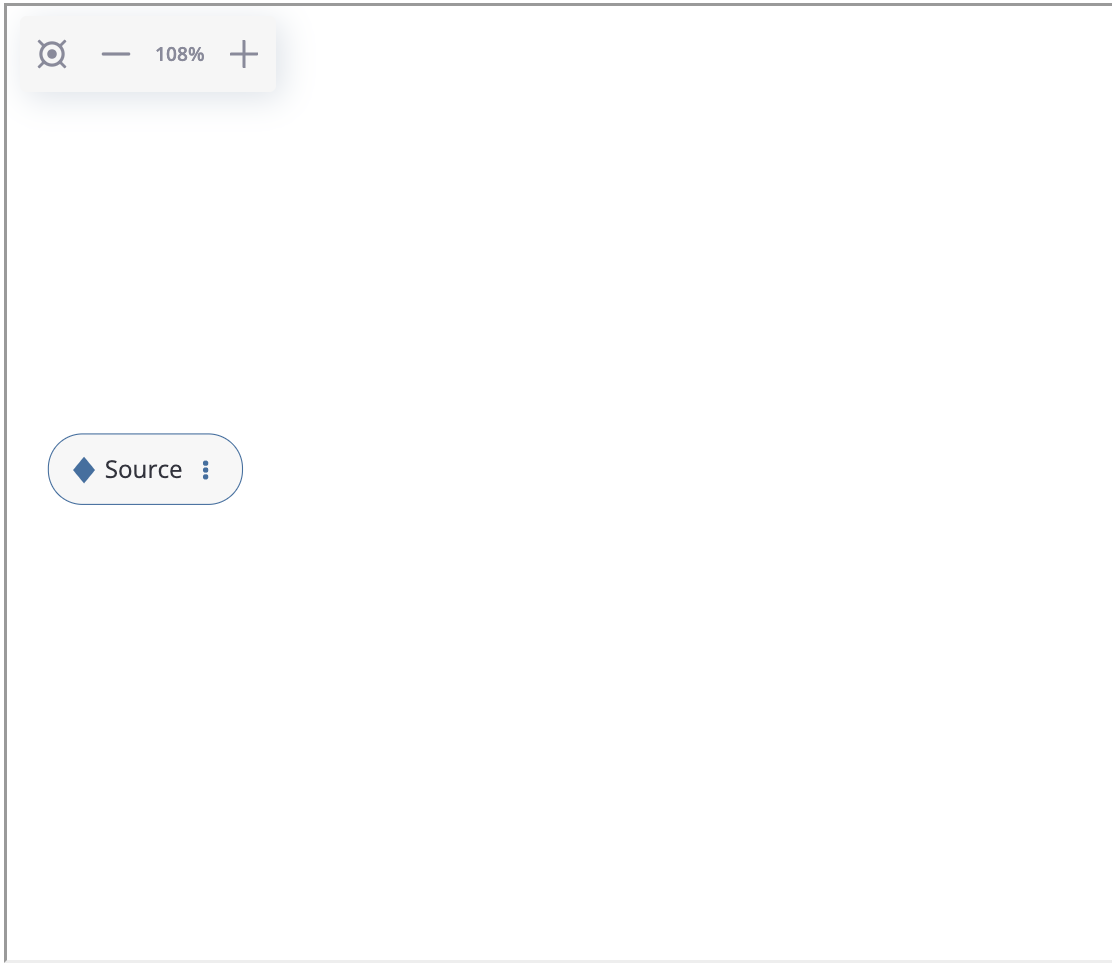
An empty preprocessing graph.#
As we see, an empty graph contains a single source node that is associated with the sourcing eventstream. Let us create the first node in the graph according to the plan. Click on the triple dots inside the node, select “Add data processor node” option and choose the AddStartEndEvents data processor as it is shown below:
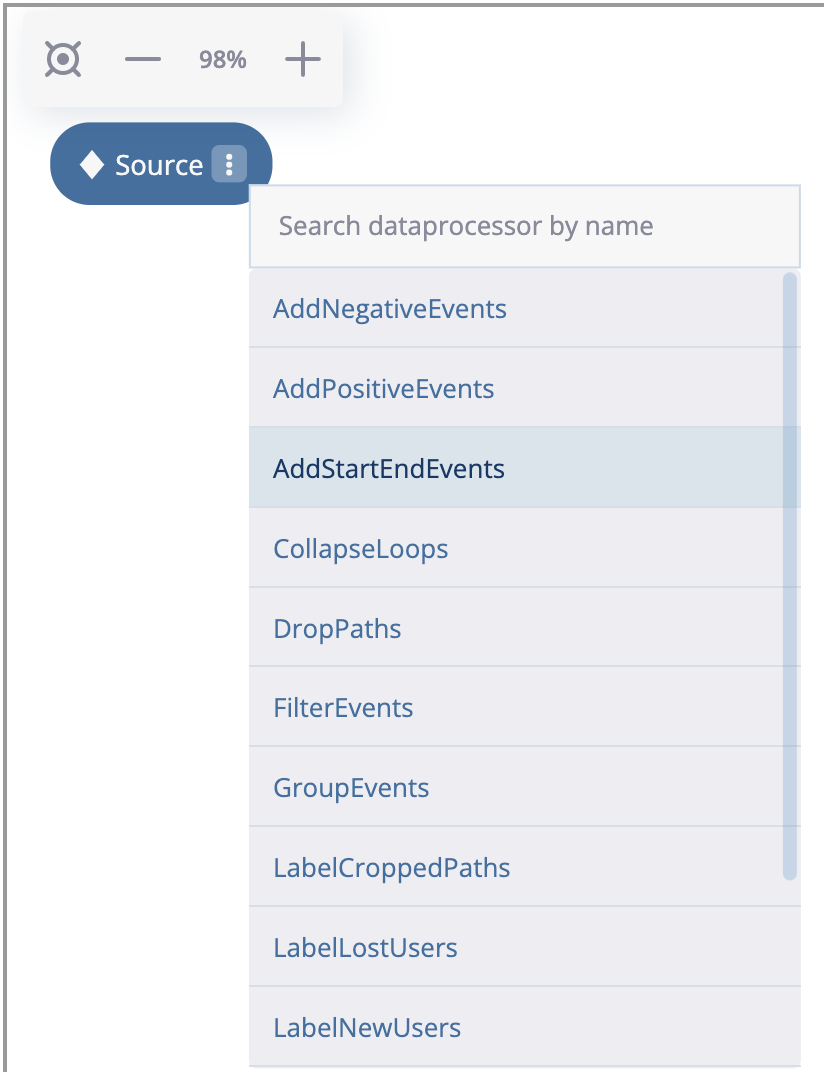
Choosing a data processor that wraps the node.#
AddStartEndEvents node appears. It is connected to the sourcing node. If we click on the node, on the right we will see the node menu. Since AddStartEndEvents data processor has no parameters, the only option available in the menu is a subtitle. Let us label the node with node1 according to the plan.
There is another important option which is worth to be mentioned. In the bottom you can see “Save Graph”. If you click it, the current state of the preprocessing graph is saved into the sourcing eventstream. So if you run stream.preprocessing_graph() again, the graph state will be restored.
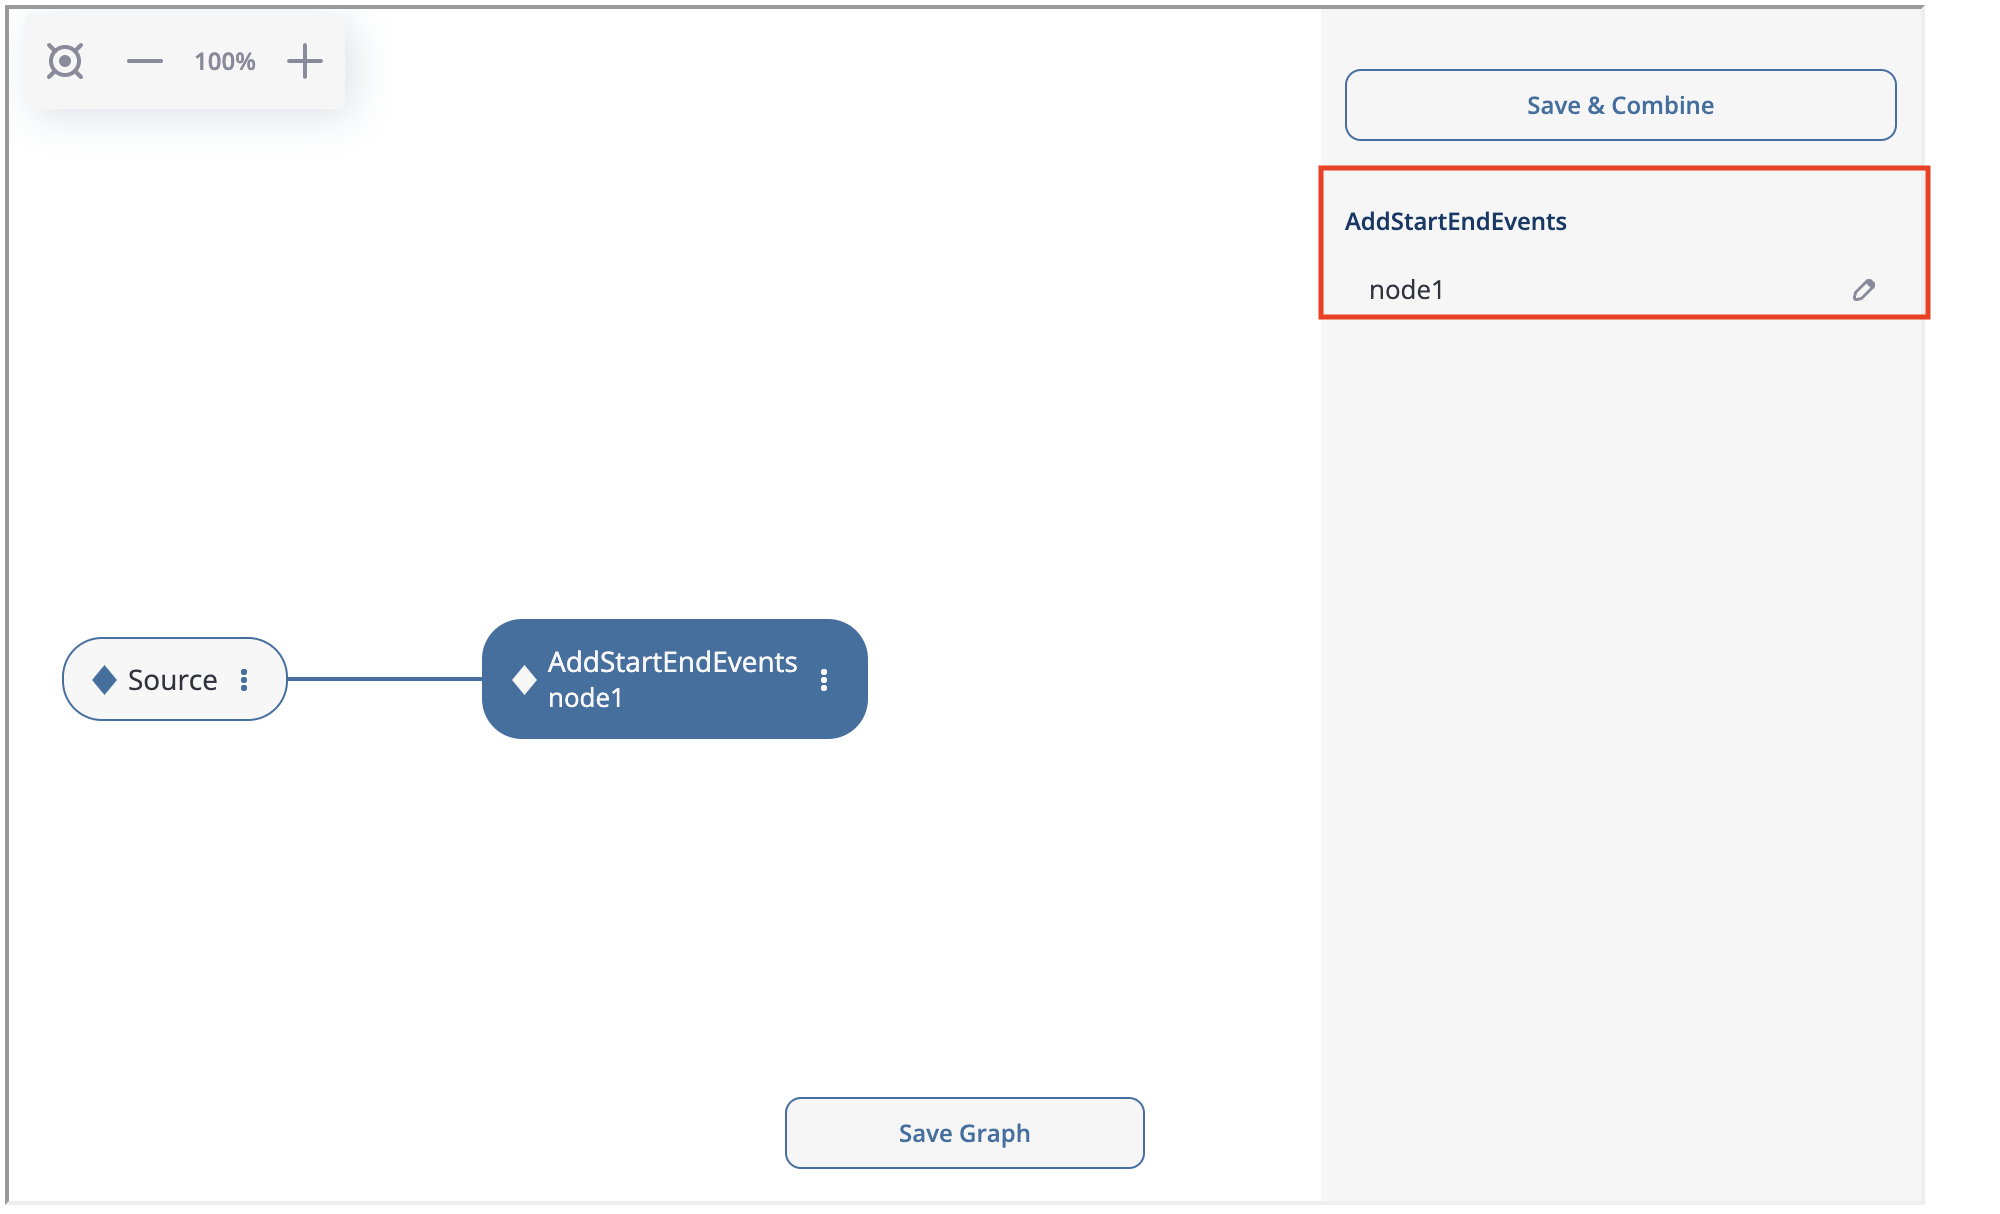
The node menu for the AddStartEndEvents data processor.#
Let us create the second node: GroupEvents. Click at node1’s triple dots (we note that “Delete node” option is available now as well), choose “Add data processor node” and choose GroupEvents. If you click on this node, the node menu appears, where you can enter the following parameter values:
The node menu for the GroupEvents data processor.#
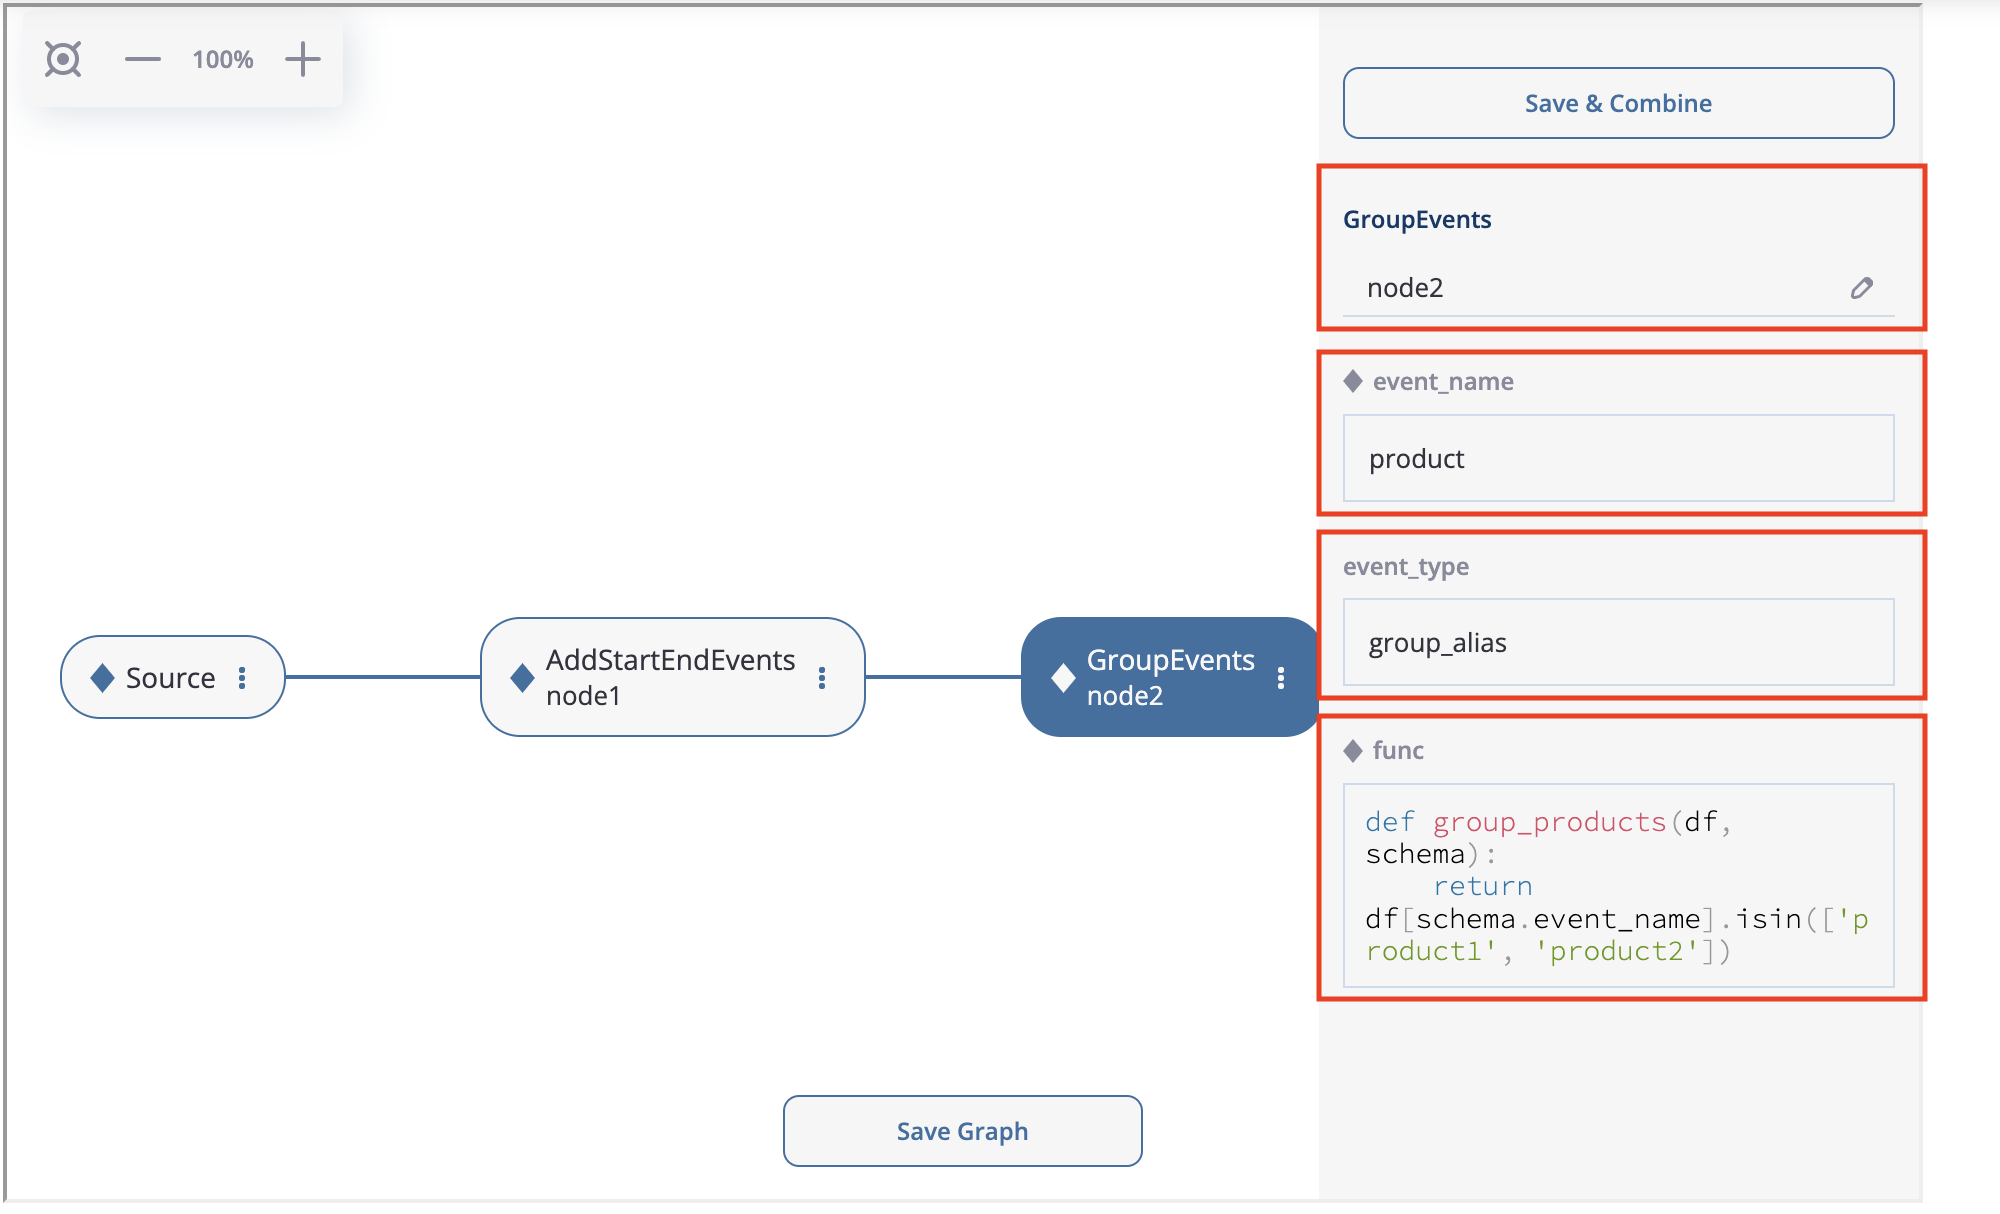
As we see, the menu contains all the parameters of the GroupEvents data processor so you can set them right here. We set the node subtitle to node2, event_name to product, and leave event_type as is. As for the func parameter, we just copy & paste the following code:
def group_products(df, schema):
    return df[schema.event_name].isin(['product1', 'product2'])
Next, we create LabelNewUsers as node3. Then we download the file containing new users ids and upload it to the new_users_list argument. Manual input is also supported, but since the number of the new users is high, it is more reasonable to upload them from the file.
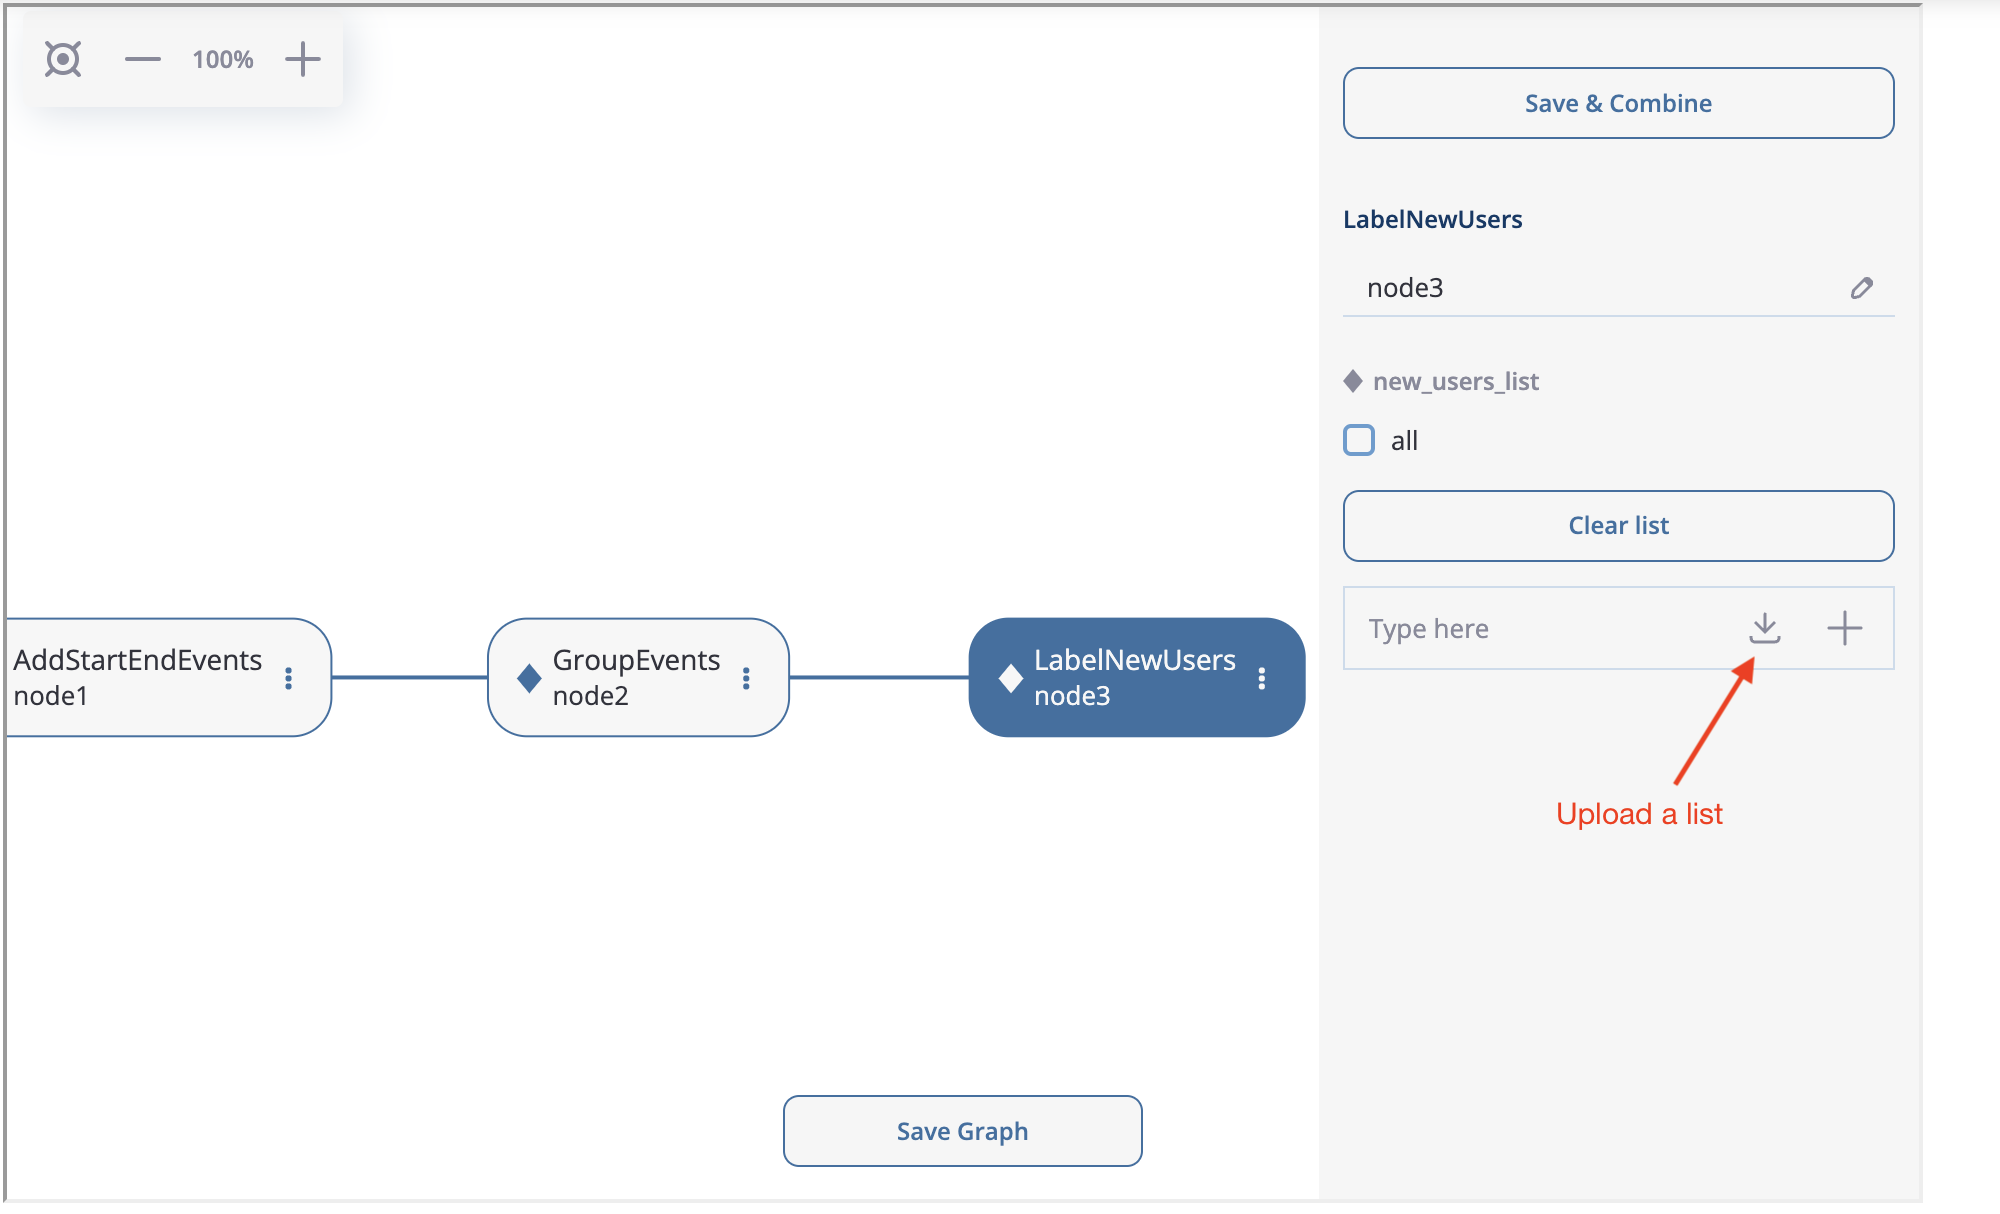
How to upload the list of new users.#
Now, we are going to implement splitting logic for node4 and node5. You can create two FilterEvents children from node3 . Similar to node2, we use get_new_users function for node4 and get_existing_users for node5. The functions are defined below:
def get_new_users(df, schema):
    new_users = df[df[schema.event_name] == 'new_user']\
        [schema.user_id]\
        .unique()
    return df[schema.user_id].isin(new_users)

def get_existing_users(df, schema):
    existing_users = df[df[schema.event_name] == 'existing_user']\
        [schema.user_id]\
        .unique()
    return df[schema.user_id].isin(existing_users)
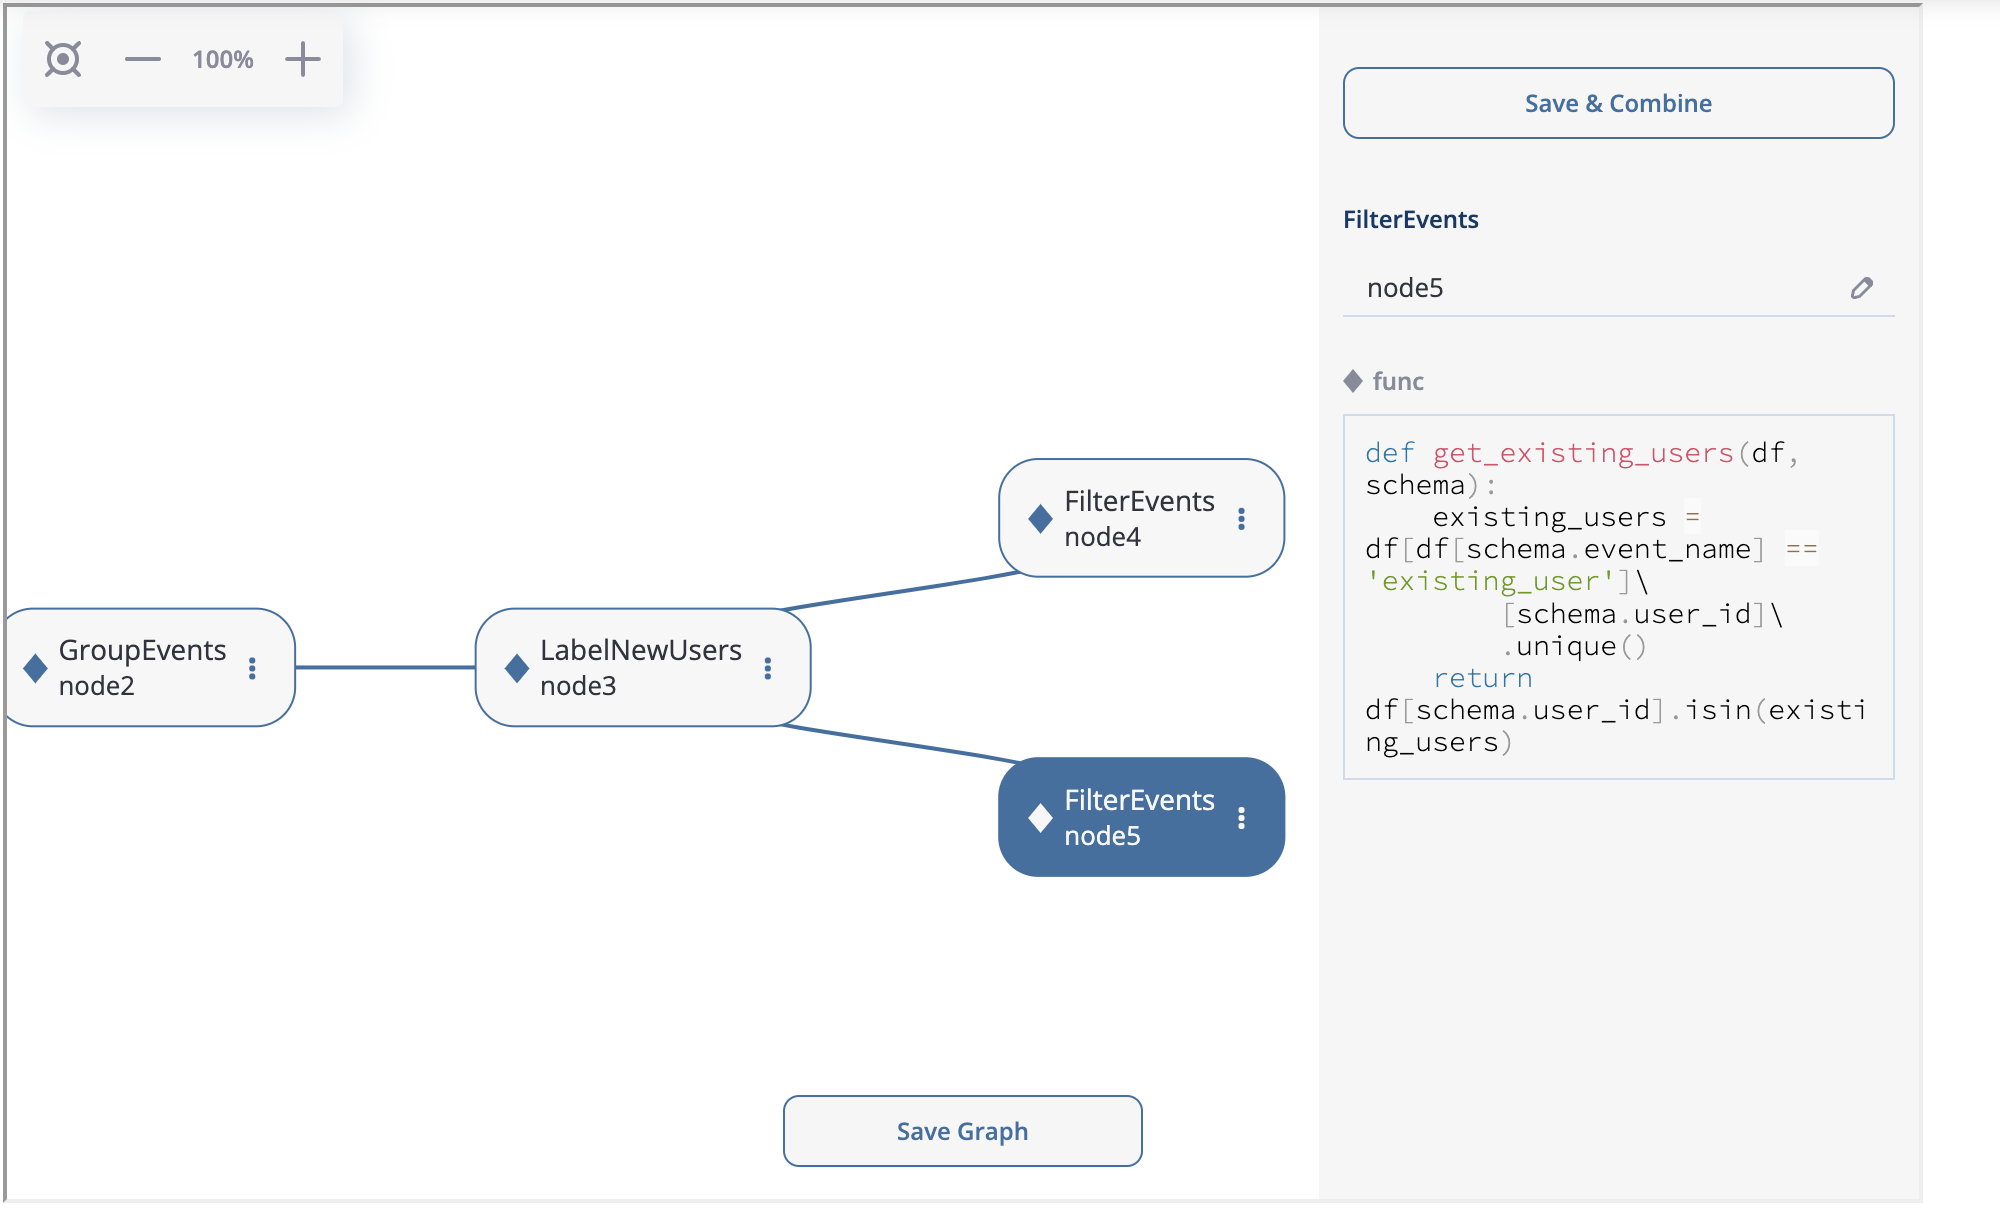
Splitting the logic after node3.#
At the next step we create LabelCroppedPaths as node6 with left_cutoff=(1, 'h') parameter. Then we connect another FilterEvents node (node7) with the remove_cropped_paths function defined below:
def remove_truncated_paths(df, schema):
    truncated_users = df[df[schema.event_name].isin(['cropped_left', 'cropped_right'])]\
        [schema.user_id]\
        .unique()
    return ~df[schema.user_id].isin(truncated_users)
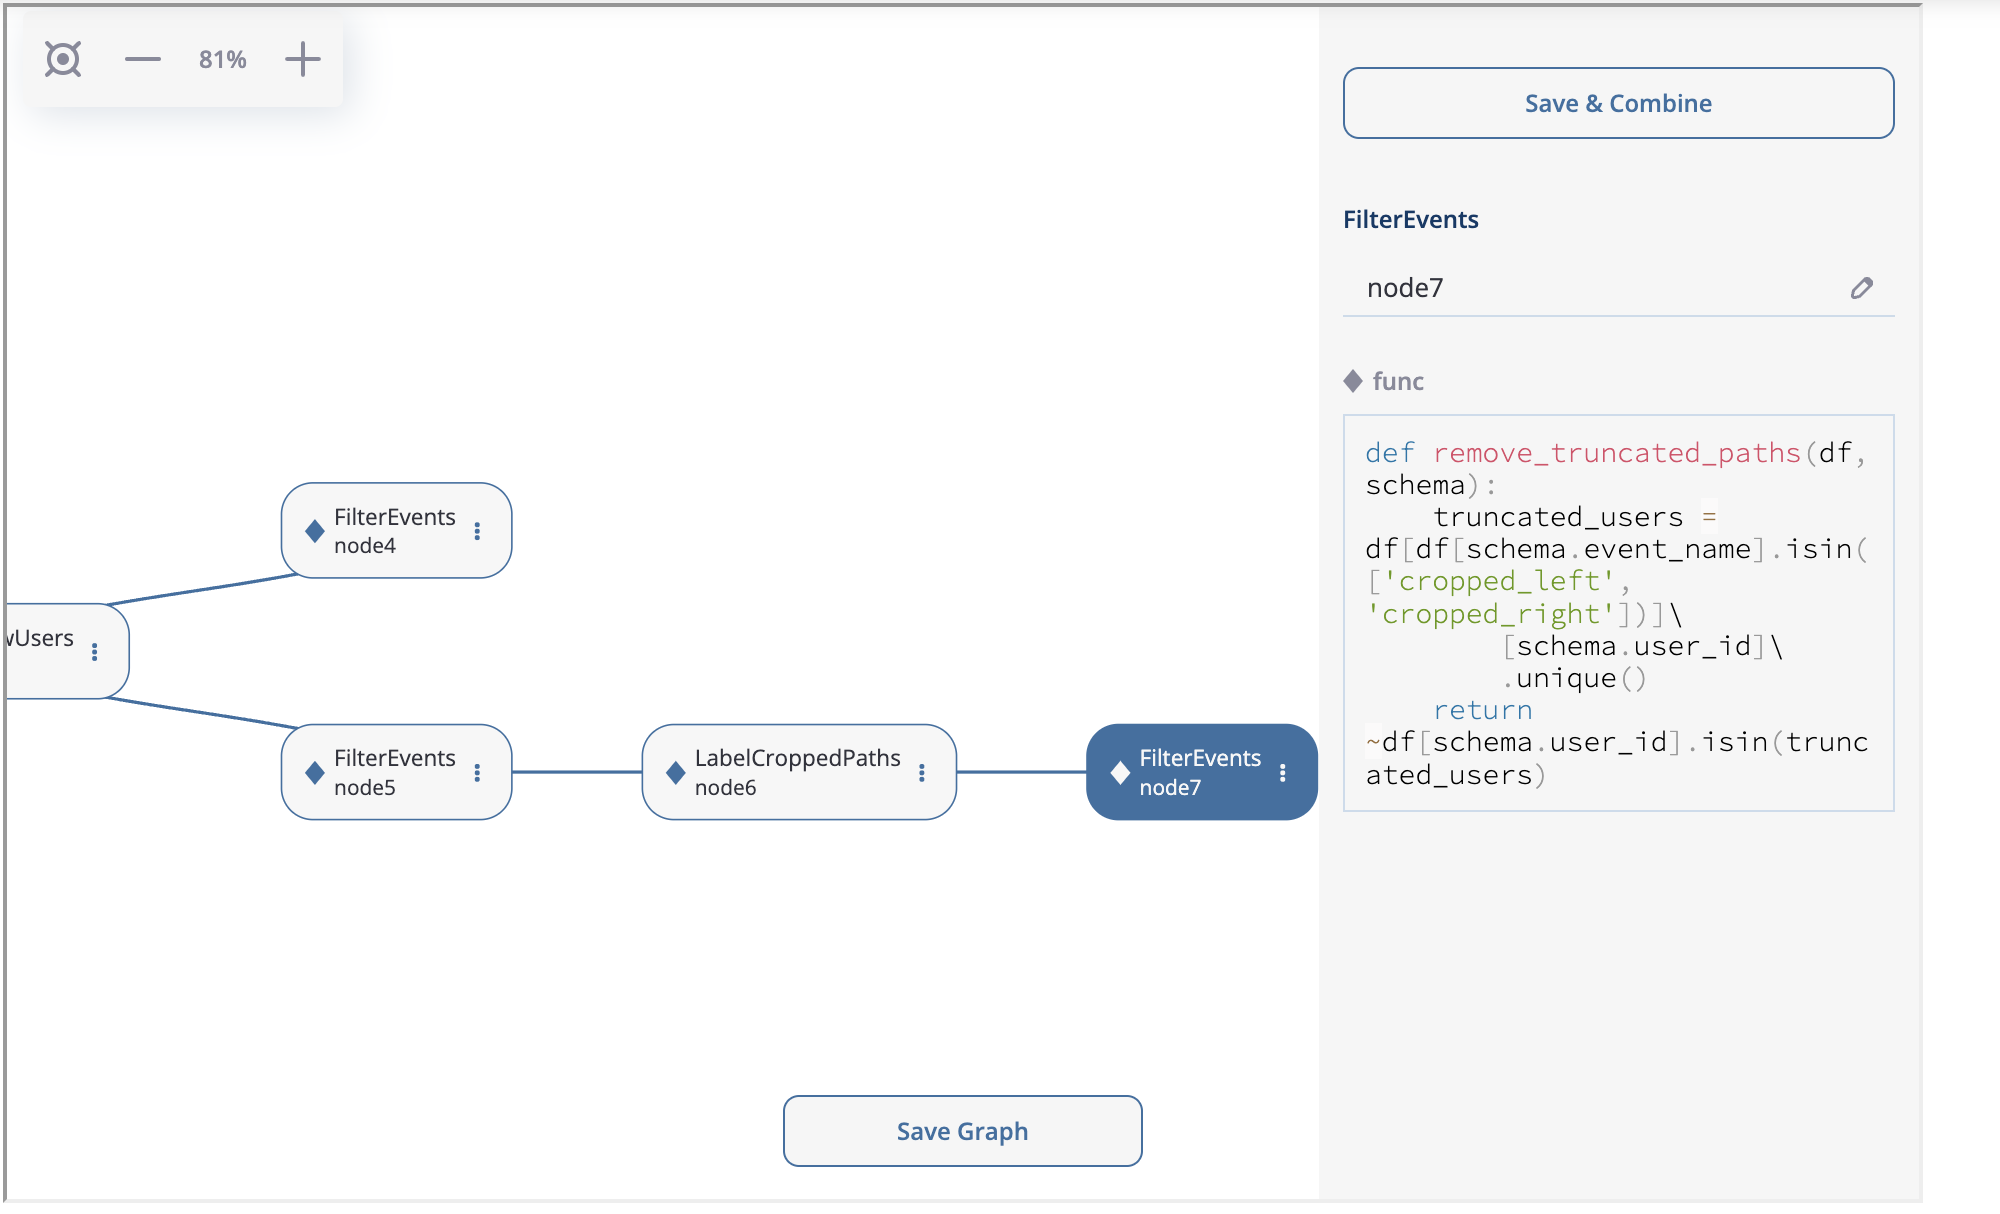
node6 and node7 creation.#
Now, we need to merge two branches into one node. Special MergeNode is designed for this purpose. To merge multiple branches select the ending points of these branches (at least 2) using Ctrl+click or Cmd+click, “Merge Nodes” button appears in the top of the canvas. After clicking this button, the merging node appears.
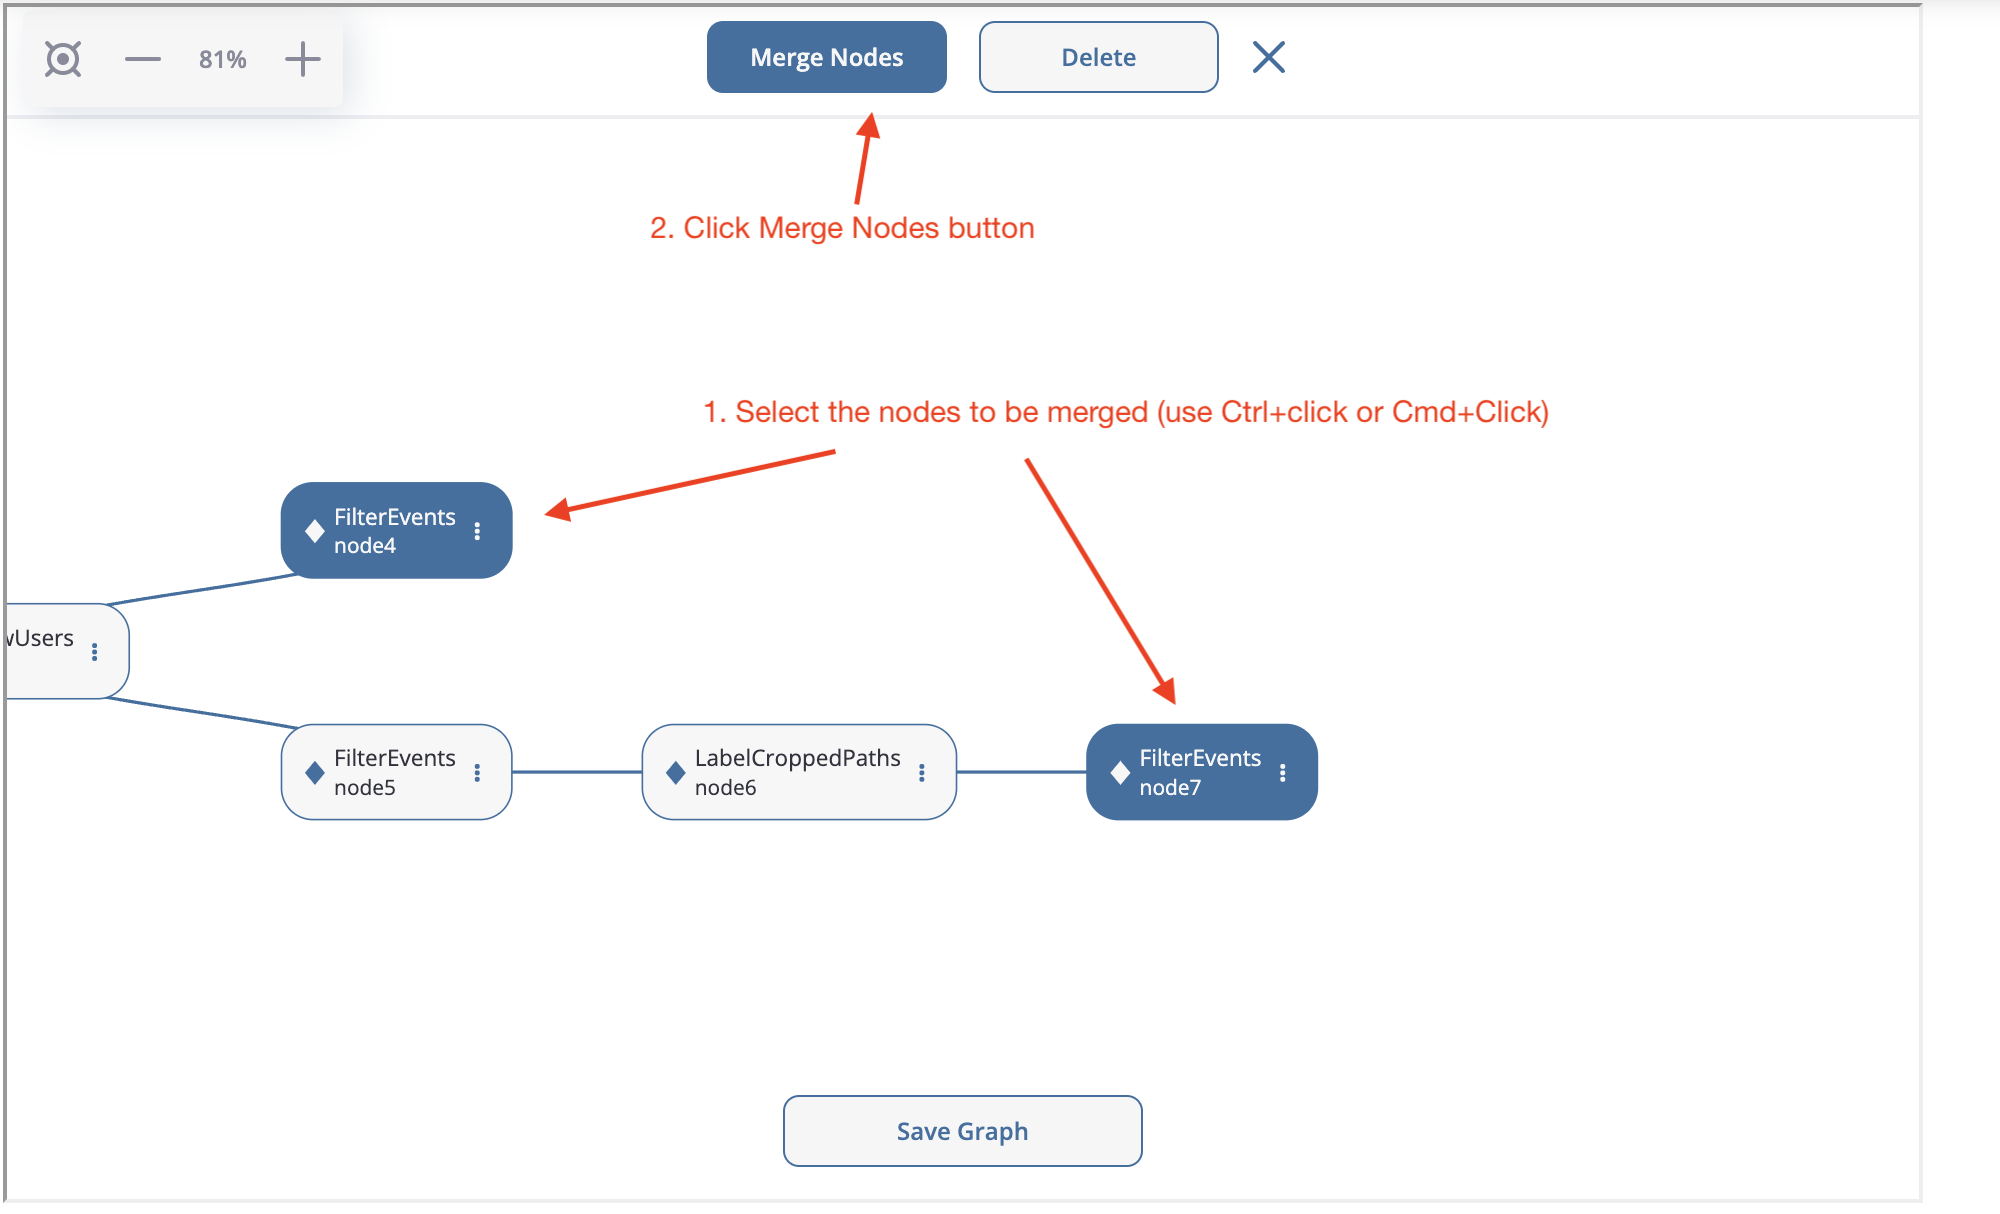
Merge node creation.#
Finally, we create the last node SplitSessions inheriting it from the merging node and setting up timeout=(30, 'm') parameter.
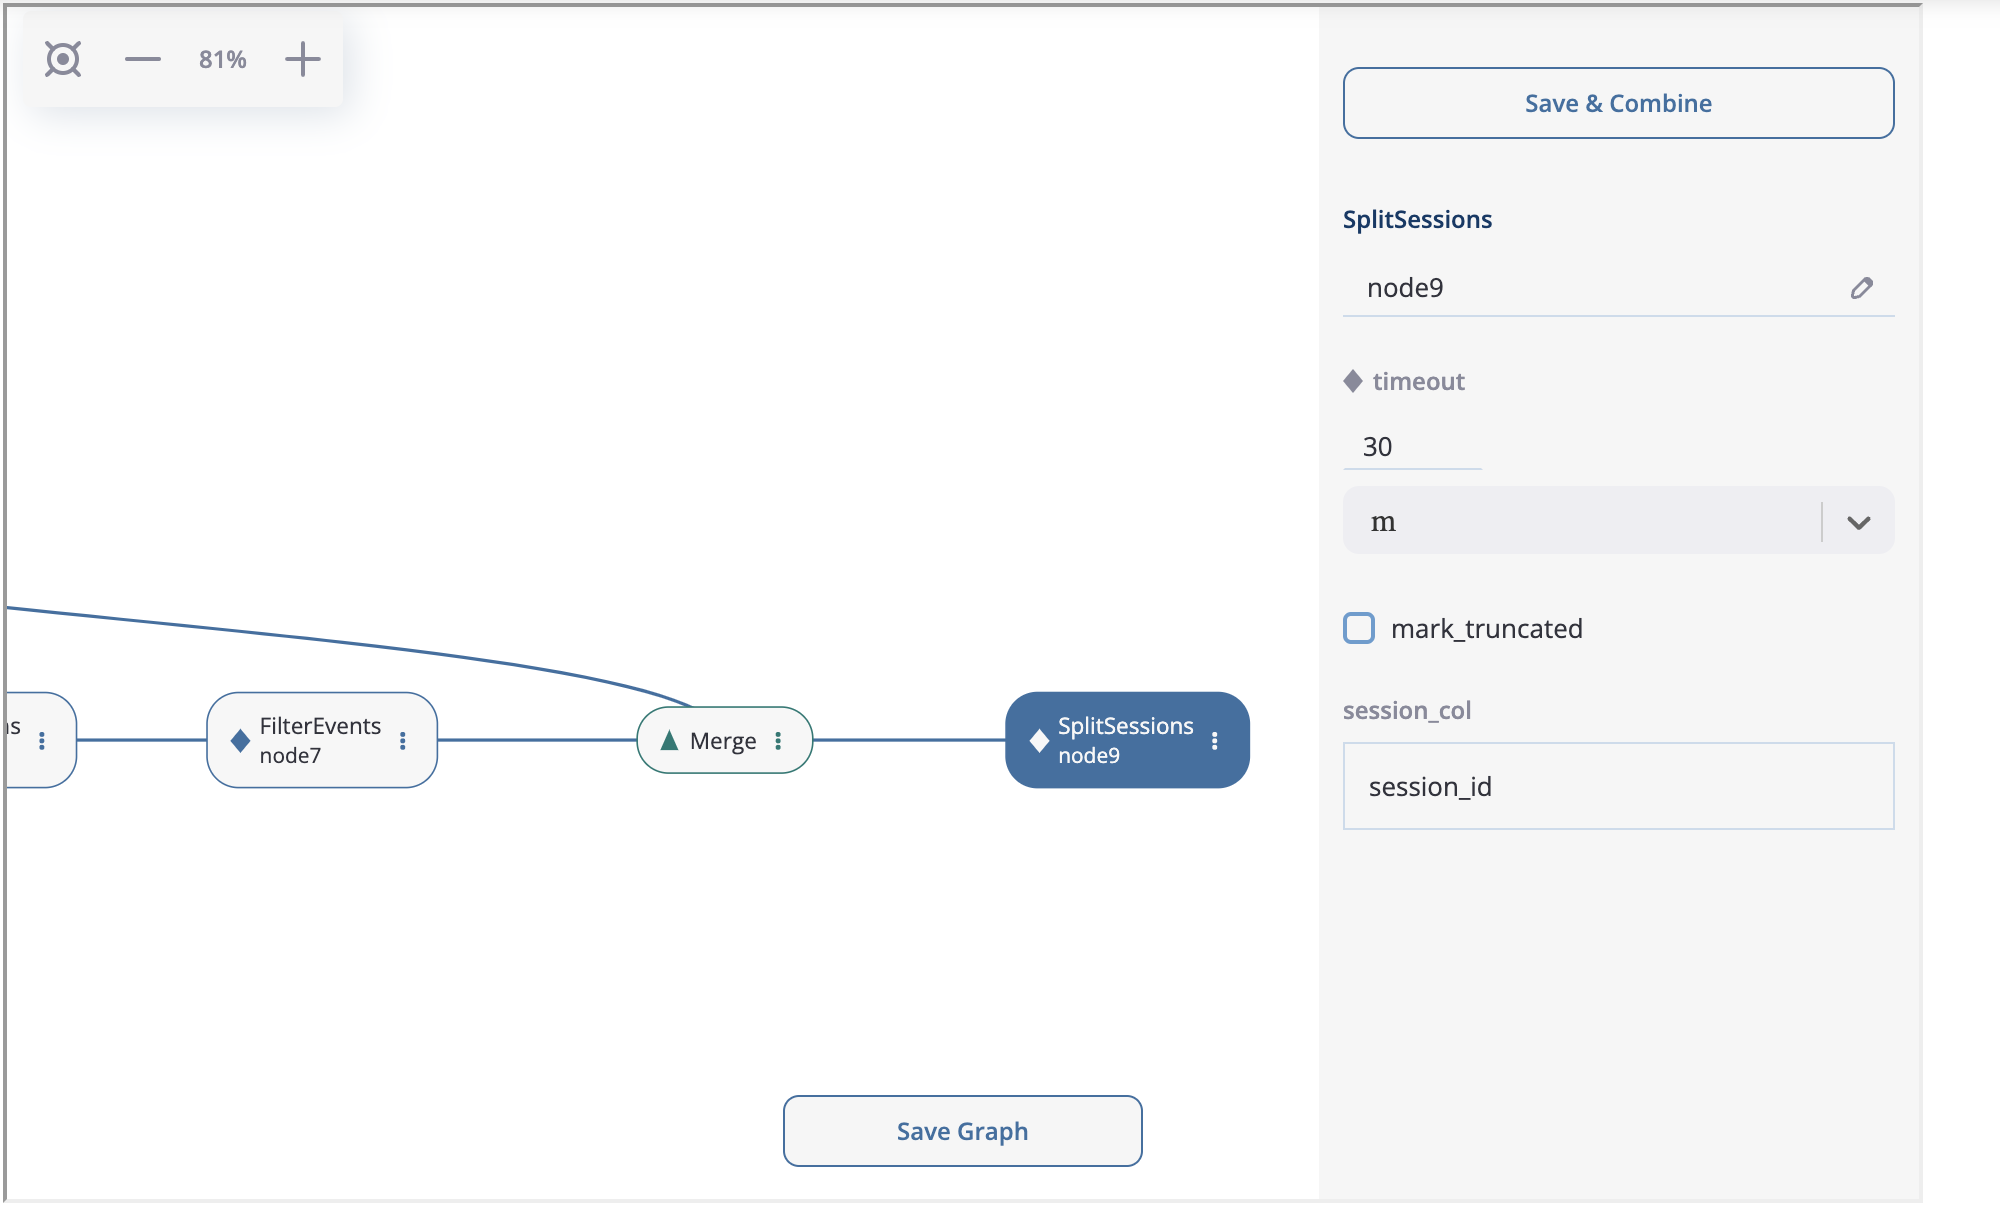
SplitSessions node.#
The graph is ready. It is time to show how to launch the calculation related to this graph. Click on the node you associate with a calculation endpoint. In our case this is node9. As it is shown in the previous screenshot, in the top right corner you will see “Save & Combine” (or just “Combine” if the graph has already been saved). As soon as the result is combined, you can extract the resulting eventstream by accessing PreprocessingGraph.combine_result. This attribute keeps the last combining result.
pgraph.combine_result.to_dataframe()
| event_id | event_type | event_index | event | timestamp | user_id | session_id | |
|---|---|---|---|---|---|---|---|
| 2 | bc2e5bf8-c199-40a6-9155-d57a1c060377 | path_start | 2 | path_start | 2019-11-01 17:59:13.273932 | 219483890.0 | 219483890.0_1 |
| 6 | 7aaabd5f-a063-46fc-91b3-2e89c24fa53d | existing_user | 6 | existing_user | 2019-11-01 17:59:13.273932 | 219483890.0 | 219483890.0_1 |
| 8 | cfe74a57-ee9e-4043-8293-12fac5adf3ff | session_start | 8 | session_start | 2019-11-01 17:59:13.273932 | 219483890.0 | 219483890.0_1 |
| 13 | 2c660a5e-8386-4334-877c-8980979cdb30 | group_alias | 13 | product | 2019-11-01 17:59:28.459271 | 219483890.0 | 219483890.0_1 |
| 16 | 0d2f7c47-fdce-498c-8b3f-5f6228ff8884 | session_end | 16 | session_end | 2019-11-01 17:59:28.459271 | 219483890.0 | 219483890.0_1 |
Code-generated preprocessing graph#
In this section we will explain how to build the same preprocessing graph as a solution for the case study but using code only. The supplementary functions that are used for GroupEvents and FilterEvents (namely, group_products, get_new_users, get_existing_users, and remove_truncated_paths) are the same as we used in the Preprocessing GUI section.
We are starting from creating an empty graph.
from retentioneering.preprocessing_graph import PreprocessingGraph

pgraph = PreprocessingGraph(stream)
As you see, PreprocessingGraph constructor requires an instance of Eventstream. The graph’s root is associated with the initial state of the eventstream which will be changed according to the graph logic.
Creating a single node#
EventsNode is a basic class for preprocessing graph node representation. As we mentioned earlier, each node is associated with a particular data processor (merging node is an exception). As an example, let us create a GroupEvents node (node2).
from retentioneering.preprocessing_graph import EventsNode
from retentioneering.data_processors_lib import GroupEvents, GroupEventsParams

def group_products(df, schema):
    return df[schema.event_name].isin(['product1', 'product2'])

group_events_params = {
    "event_name": "product",
    "func": group_products
}

data_processor_params = GroupEventsParams(**group_events_params)
data_processor = GroupEvents(params=data_processor_params)
node2 = EventsNode(data_processor)
What is happening in this example? The data processor’s parameters are set with the help of *Params class where the asterisk stands for a data processor name. Namely, there is GroupEventsParams parameter class for GroupEvents. The arguments of a *Params class constructor are exactly the same as the corresponding parameter names. For GroupEventsParams they are event_name and func which we keep here as group_events_params dictionary items. group_products function returns the mask for grouping events product1 and product2.
Next, we pass data_processor_params object to the only parameter params of the GroupEvents() constructor and assign its result to the data_processor variable.
Finally, we pass the data processor instance to the EventsNode class constructor and get our node.
Since all three classes’ constructors involved in the node creation process have a single parameter, it’s convenient to create a node with a single line of code as follows:
node2 = EventsNode(GroupEvents(params=GroupEventsParams(**group_events_params)))
If you were surprised why we did not start with node1 according to the plan, here is a clue. The reason is that the AddStartEndEvents data processor does not have any arguments. However, even in this case we have to create an instance of StartEndEventsParams and pass it to the data processor constructor. Look how you can do it:
from retentioneering.data_processors_lib import AddStartEndEvents, AddStartEndEventsParams

node1 = EventsNode(AddStartEndEvents(params=AddStartEndEventsParams()))
Linking nodes#
In order to link a node to its parents, call PreprocessingGraph.add_node(). The method accepts a node object and its parents list. A regular node must have a single parent, whereas a merging node must have at least two parents. We will demonstrate how merging nodes work in the next subsection. As of now, here is how to connect a pair of nodes of our graph:
pgraph.add_node(node=node1, parents=[pgraph.root])
pgraph.add_node(node=node2, parents=[node1])
Note that node1 is linked to a special graph.root node which is a mandatory attribute of any graph. node2 is connected to a regular node node1.
So we have described how to create the graph nodes and how to link the nodes. Using these two basic operations we can construct the whole graph.
Building the whole graph#
Let us create the other graph nodes and link them step-by-step according to the plan.
To create node3 we need either to download the list of the new users beforehand. This list contains user_ids of the users who are considered as new (i.e. they have not visited the system any time before the dataset start). We assign the downloaded list to new_users variable and then pass it to LabelNewUsersParams.
from retentioneering.data_processors_lib import LabelNewUsers, LabelNewUsersParams

google_spreadsheet_id = '1iggpIT5CZcLILLZ94wCZPQv90tERwi1IB5Y1969C8zc'
link = f'https://docs.google.com/spreadsheets/u/1/d/{google_spreadsheet_id}/export?format=csv&id={google_spreadsheet_id}'
new_users = pd.read_csv(link, header=None)[0].tolist()
node3 = EventsNode(LabelNewUsers(params=LabelNewUsersParams(new_users_list=new_users)))
pgraph.add_node(node=node3, parents=[node2])
Creation of the next node4 and node5 is similar. We need to create a couple of nodes with FilterEvents data processors and pass them filtering functions get_new_users() and get_existing_users(). These two functions recognize synthetic events new_user and existing_user added by LabelNewUsers data processor at the previous step and leave the paths of new users and existing users only correspondingly.
from retentioneering.data_processors_lib import FilterEvents, FilterEventsParams

def get_new_users(df, schema):
    new_users = df[df[schema.event_name] == 'new_user']\
        [schema.user_id]\
        .unique()
    return df[schema.user_id].isin(new_users)

def get_existing_users(df, schema):
    existing_users = df[df[schema.event_name] == 'existing_user']\
        [schema.user_id]\
        .unique()
    return df[schema.user_id].isin(existing_users)


node4 = EventsNode(FilterEvents(params=FilterEventsParams(func=get_new_users)))
node5 = EventsNode(FilterEvents(params=FilterEventsParams(func=get_existing_users)))
pgraph.add_node(node=node4, parents=[node3])
pgraph.add_node(node=node5, parents=[node3])
There is nothing new in the creation of the node6. We just pass a couple of left_cutoff and right_cutoff parameters to LabelCroppedPathsParams and set up a LabelCroppedPaths node.
from retentioneering.data_processors_lib import LabelCroppedPaths, LabelCroppedPathsParams

params = {
    "left_cutoff": (1, 'h'),
    "right_cutoff": (1, 'h'),
}
node6 = EventsNode(LabelCroppedPaths(params=LabelCroppedPathsParams(**params)))
pgraph.add_node(node=node6, parents=[node5])
For node7 we apply similar filtering technique as we used for filtering new/existing users above. The remove_truncated_paths() function implements this filter.
def remove_truncated_paths(df, schema):
    truncated_users = df[df[schema.event_name].isin(['cropped_left', 'cropped_right'])]\
        [schema.user_id]\
        .unique()
    return ~df[schema.user_id].isin(truncated_users)

node7 = EventsNode(FilterEvents(params=FilterEventsParams(func=remove_truncated_paths)))
pgraph.add_node(node=node7, parents=[node6])
Next, node8. As we discussed earlier, MergeNode has two special features. Unlike EventsNode, MergeNode is not associated with any data processor since it has a separate role – concatenate the outputs of its parents. Another distinction from EventsNode is that the number of parents might be arbitrary (greater than 1). The following two lines of the code demonstrate both these features:
from retentioneering.preprocessing_graph import MergeNode

node8 = MergeNode()
pgraph.add_node(node=node8, parents=[node4, node7])
Finally, for node9 we wrap SplitSessions data processor to a node passing a single parameter timeout and link it to the merging node:
from retentioneering.data_processors_lib import SplitSessions, SplitSessionsParams

node9 = EventsNode(SplitSessions(params=SplitSessionsParams(timeout=(30, 'm'))))
pgraph.add_node(node=node9, parents=[node8])
Running the calculation#
So we have built the graph, now it’s time to run the entire calculation which the graph frames. In order to run the calculation from the graph root to a specific node, call PreprocessingGraph.combine() method with a single parameter node which accepts the corresponding node object. The result is represented as the Eventstream class.
processed_stream = pgraph.combine(node=node9)
processed_stream.to_dataframe().head()
| event_id | event_type | event_index | event | timestamp | user_id | session_id | |
|---|---|---|---|---|---|---|---|
| 2 | bc2e5bf8-c199-40a6-9155-d57a1c060377 | path_start | 2 | path_start | 2019-11-01 17:59:13.273932 | 219483890.0 | 219483890.0_1 |
| 6 | 7aaabd5f-a063-46fc-91b3-2e89c24fa53d | existing_user | 6 | existing_user | 2019-11-01 17:59:13.273932 | 219483890.0 | 219483890.0_1 |
| 8 | cfe74a57-ee9e-4043-8293-12fac5adf3ff | session_start | 8 | session_start | 2019-11-01 17:59:13.273932 | 219483890.0 | 219483890.0_1 |
| 13 | 2c660a5e-8386-4334-877c-8980979cdb30 | group_alias | 13 | product | 2019-11-01 17:59:28.459271 | 219483890.0 | 219483890.0_1 |
| 16 | 0d2f7c47-fdce-498c-8b3f-5f6228ff8884 | session_end | 16 | session_end | 2019-11-01 17:59:28.459271 | 219483890.0 | 219483890.0_1 |
Note
You can combine the calculations at any node. In practice, it is useful for debugging the calculations.
Summary#
Here we just provide the same code combined in a single chunk so you could simply copy and paste it and see the results.
import pandas as pd
from retentioneering import datasets
from retentioneering.data_processors_lib import AddStartEndEvents, AddStartEndEventsParams
from retentioneering.data_processors_lib import GroupEvents, GroupEventsParams
from retentioneering.data_processors_lib import LabelNewUsers, LabelNewUsersParams
from retentioneering.data_processors_lib import FilterEvents, FilterEventsParams
from retentioneering.data_processors_lib import LabelCroppedPaths, LabelCroppedPathsParams
from retentioneering.data_processors_lib import SplitSessions, SplitSessionsParams
from retentioneering.preprocessing_graph import PreprocessingGraph, EventsNode, MergeNode

stream = datasets.load_simple_shop()

# node1
node1 = EventsNode(AddStartEndEvents(params=AddStartEndEventsParams()))

# node2
def group_products(df, schema):
    return df[schema.event_name].isin(['product1', 'product2'])

group_events_params={
    "event_name": "product",
    "func": group_products
}
node2 = EventsNode(GroupEvents(params=GroupEventsParams(**group_events_params)))

# node3
google_spreadsheet_id = '1iggpIT5CZcLILLZ94wCZPQv90tERwi1IB5Y1969C8zc'
link = f'https://docs.google.com/spreadsheets/u/1/d/{google_spreadsheet_id}/export?format=csv&id={google_spreadsheet_id}'
new_users = pd.read_csv(link, header=None)[0].tolist()
node3 = EventsNode(LabelNewUsers(params=LabelNewUsersParams(new_users_list=new_users)))

# node4, node5
def get_new_users(df, schema):
    new_users = df[df[schema.event_name] == 'new_user']\
        [schema.user_id]\
        .unique()
    return df[schema.user_id].isin(new_users)

def get_existing_users(df, schema):
    existing_users = df[df[schema.event_name] == 'existing_user']\
        [schema.user_id]\
        .unique()
    return df[schema.user_id].isin(existing_users)

node4 = EventsNode(FilterEvents(params=FilterEventsParams(func=get_new_users)))
node5 = EventsNode(FilterEvents(params=FilterEventsParams(func=get_existing_users)))

# node6
params = {
    "left_cutoff": (1, 'h'),
    "right_cutoff": (1, 'h'),
}
node6 = EventsNode(LabelCroppedPaths(params=LabelCroppedPathsParams(**params)))

# node7, node8, node9
def remove_truncated_paths(df, schema):
    truncated_users = df[df[schema.event_name].isin(['cropped_left', 'cropped_right'])]\
        [schema.user_id]\
        .unique()
    return ~df[schema.user_id].isin(truncated_users)

node7 = EventsNode(FilterEvents(params=FilterEventsParams(func=remove_truncated_paths)))
node8 = MergeNode()
node9 = EventsNode(SplitSessions(params=SplitSessionsParams(timeout=(30, 'm'))))

# linking the nodes to get the graph
pgraph = PreprocessingGraph(stream)
pgraph.add_node(node=node1, parents=[pgraph.root])
pgraph.add_node(node=node2, parents=[node1])
pgraph.add_node(node=node3, parents=[node2])
pgraph.add_node(node=node4, parents=[node3])
pgraph.add_node(node=node5, parents=[node3])
pgraph.add_node(node=node6, parents=[node5])
pgraph.add_node(node=node7, parents=[node6])
pgraph.add_node(node=node8, parents=[node4, node7])
pgraph.add_node(node=node9, parents=[node8])

# getting the calculation results
processed_stream = pgraph.combine(node=node9)
processed_stream.to_dataframe().head()
Import & export graph#
To save a preprocessing graph configuration for future use, use either → Export graph menu option or PreprocessingGraph.export_to_file() method.
path_link = '/path/to/pgraph_config.json'
pgraph.export_to_file(path_link)
There are two ways to load a graph from the previously saved the JSON file. One is to use PreprocessingGraph.import_from_file() method.
# load data and create new PreprocessingGraph instance
new_stream = datasets.load_simple_shop()
new_pgraph = new_stream.preprocessing_graph()

# restore the saved preprocessing configuration
path_link = '/path/to/pgraph_config.json'
new_pgraph.import_from_file(path_link)
For example, you can download here and import the same graph that we constructed in the case study.
These methods are also available through the graph interface:
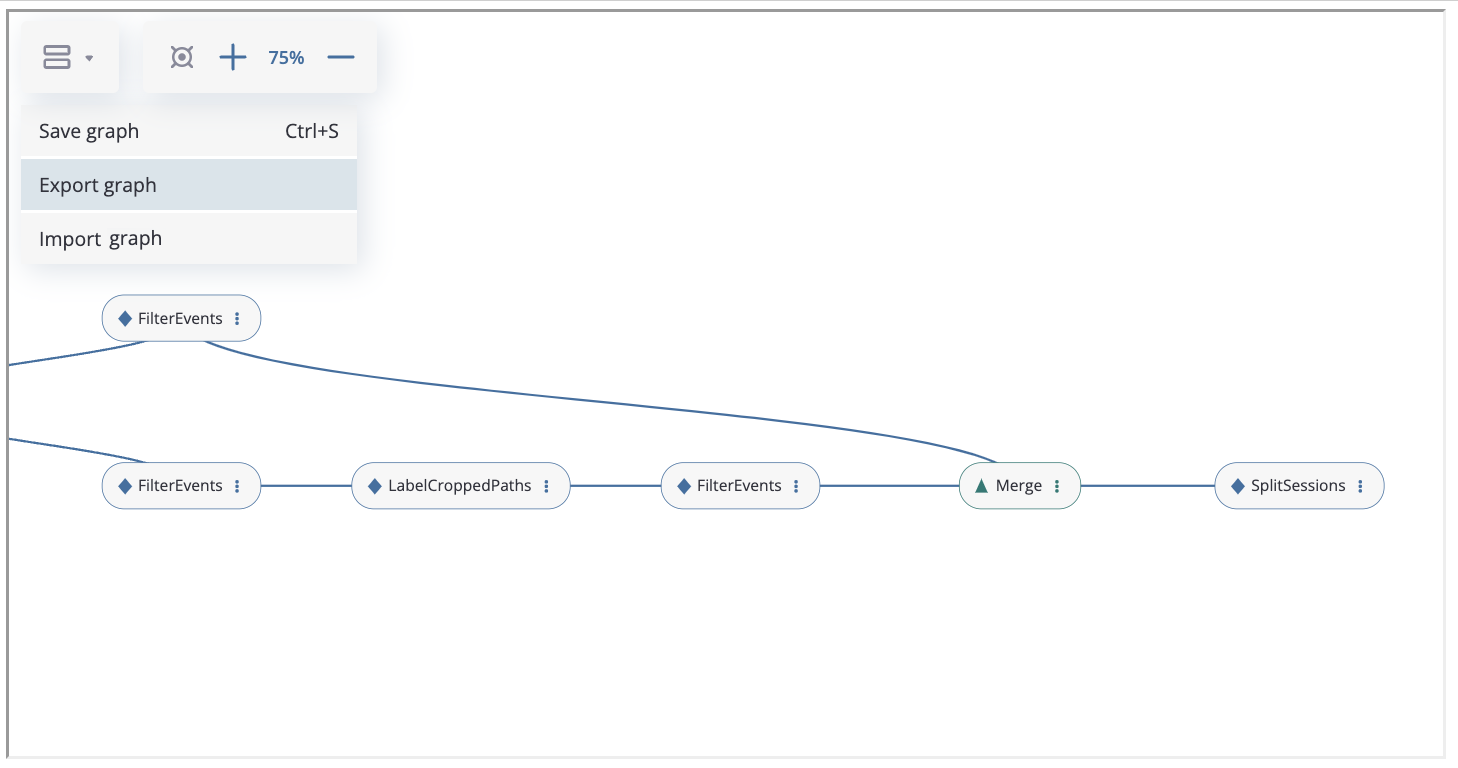
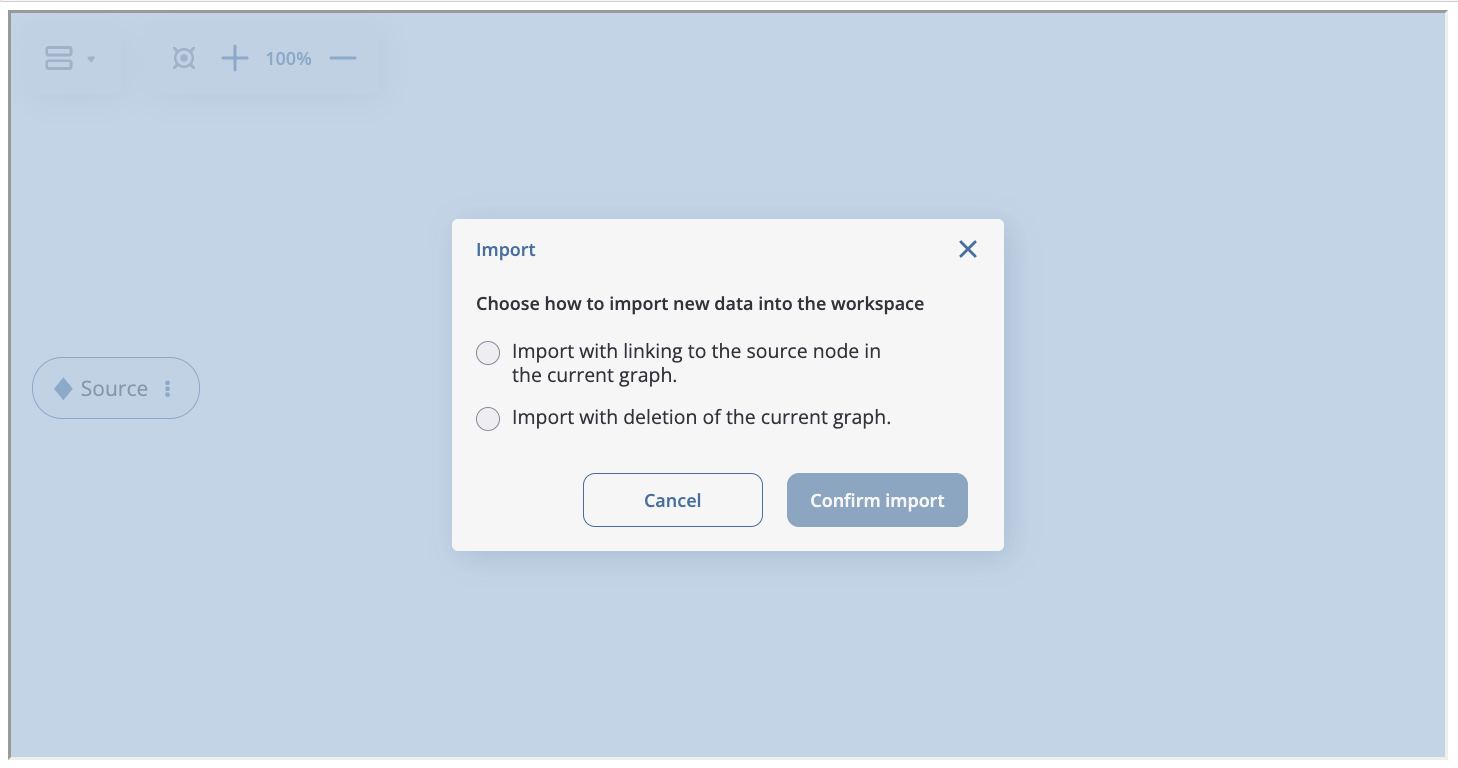
The graph can be saved by clicking the “Save Graph” button, exported to json file and imported from json file (“Export Graph” and “Import Graph” buttons).
When importing through the interface, there are two options available: adding the chain of data processors from the file to the existing graph or completely replacing the graph with the imported one:
Note
When using the export and import functionality of the preprocessing graph, it is important to consider that new data and its characteristics may be different from those for which the graph is constructed (event names may change, there will be a new division of users into groups, etc.). Therefore, sometimes it may be necessary to change data processors parameters (list of new users, function for filtering, name of target event) to accommodate the specifics of the new dataset.
Method chaining for preprocessing graph#
In the previous sections we have constructed complex example. Let us consider one more way of preprocessing graph usage. It is based on method chaining approach and could be easily applied if there is no need branching and merging logic. In the end we will illustrate the result with TransitionGraph visualization. By default, edge values are absolute unless edges_norm_type is specified. In this case edge values are percentage ratios. In the examples below,
we will use mostly edges_norm_type='node'.
We are going to use the same simple_shop dataset dataset. If we try to use TransitionGraph without applying data processors, we can get results that are difficult to analyze:
stream.transition_graph(edges_norm_type='node')
By using the transition graph interactive options, we could focus on specific event transitions. However, even the general user workflow can be difficult to see - because of many ungrouped events, loops, and states.
We can address this problem by using a combination of data processors we have seen previously. One example of a processing graph would look like this:
apply
DropPathsto remove users that could have appeared by accident;apply
AddStartEndEventsto mark the start and finish user states;apply
SplitSessionsto mark user sessions;apply
GroupEventsmultiple times to group similar events into groups;apply
CollapseLoopswith different parameters for different loop representations on the transition graph plot.
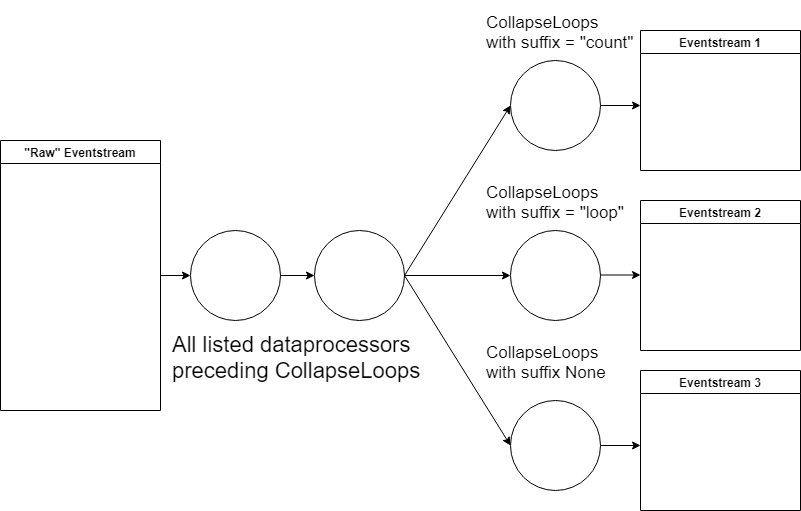
As the result, we should get three similar eventstreams that differ only in their way of encoding loops. That is the main inherent advantage of using the graph structure for transformations. We only need to execute all common data processors once, and then we can quickly alternate between different “heads” of the transformation.
Let us compose this graph:
def group_browsing(df, schema):
    return df[schema.event_name].isin(['catalog', 'main'])

def group_products(df, schema):
    return df[schema.event_name].isin(['product1', 'product2'])

def group_delivery(df, schema):
    return df[schema.event_name].isin(['delivery_choice', 'delivery_courier', 'delivery_pickup'])

def group_payment(df, schema):
    return df[schema.event_name].isin(['payment_choice', 'payment_done', 'payment_card', 'payment_cash'])

stream_7_nodes = stream\
    .drop_paths(min_steps=6)\
    .add_start_end_events()\
    .split_sessions(timeout=(30, 'm'))\
    .group_events(event_name='browsing', func=group_browsing)\
    .group_events(event_name='delivery', func=group_delivery)\
    .group_events(event_name='payment', func=group_payment)
Looking at the simplest version, where loops are replaced with the event they consist of:
stream_out = stream_7_nodes.collapse_loops()
stream_out.transition_graph(edges_norm_type='node')
This transition graph is much more comprehensible. After applying the data processors, we can see that:
All sessions start with a
browsingevent. And more than 30% of transitions frombrowsinglead to the end of the session.There are many returning sessions - more than 50% of transitions from this node lead to further sessions.
After transitioning from “cart” to “delivery”, about 30% of transitions do not proceed to “payment”.
We can also see the general user flow quite clearly now, which is a sufficient improvement compared to the original plot.
To learn more about loops and where they occur, let us plot two other versions of the eventstream:
stream_out = stream_7_nodes.collapse_loops(suffix='loop')
stream_out.transition_graph(edges_norm_type='node')
In this plot (which is a bit more convoluted than the previous one), we see that loops mostly occur when users are browsing, and are less frequent at the delivery or payment stages. However, there are a lot more transitions to payment_loop or delivery_loop than there are to payment or delivery. This could suggest that there is a problem with the delivery/payment process, or that we could improve the process by reducing the number of transitions (i.e. “clicks”) it takes to make an order a delivery or to pay.
Now we can attempt to look at the typical loop length using the third created eventstream:
stream_out = stream_7_nodes.collapse_loops(suffix='count')
stream_out.transition_graph()
This plot is a bit more complex than the previous two; to properly analyze it, we would need to filter out some loop events based on their frequency. Still, we can see that the longest loops occur at the browsing stage - and cart, payment, or delivery loops are limited by 2-3 steps, meaning that the problem we found might not be as critical as it first appeared.