Quick start with Retentioneering#
![]()

Retentioneering is a Python library for in-depth analysis of what is commonly called user clickstream. We find the traditional term clickstream to be too constrictive, as user actions may not just be clicks; instead, we use the term event to mean any user action, and eventstream to refer to a set of actions performed by the user. A set of events belonging to a particular user is called user path or user trajectory, and sometimes customer journey map (CJM) is used as a synonym for eventstream.
Each event is tied to the user who experienced it, and a timestamp. Hence, at a basic level, eventstream comprises a set of triples like these:
('user_1', 'login', '2019-01-01 00:00:00'),
('user_1', 'main_page_visit', '2019-01-01 00:00:00'),
('user_1', 'cart_button_click', '2019-01-01 00:00:00'),
...
Any eventstream research consists of three fundamental steps:
Loading data
Preparing the data
Applying Retentioneering tools
This document is a brief overview of how to follow these steps. For more detail, see the User Guides.
Loading data#
This is the introduction to our core class Eventstream, which stores eventstream events and enables you to work with them efficiently.
We have provided a small simple_shop dataset for you to use for demo purposes here, and throughout the documentation.
from retentioneering import datasets

# load sample user behavior data:
stream = datasets.load_simple_shop()
In the shell of eventstream object there is a regular pandas.DataFrame which can be revealed by calling to_dataframe() method:
stream.to_dataframe().head()
| user_id | event | timestamp | |
|---|---|---|---|
| 0 | 219483890 | catalog | 2019-11-01 17:59:13.273932 |
| 1 | 219483890 | product1 | 2019-11-01 17:59:28.459271 |
| 2 | 219483890 | cart | 2019-11-01 17:59:29.502214 |
| 3 | 219483890 | catalog | 2019-11-01 17:59:32.557029 |
| 4 | 964964743 | catalog | 2019-11-01 21:38:19.283663 |
In this fragment of the dataset, user 219483890 has 4 events with timestamps on the website on 2019-11-01.
If you are OK with the simple_shop dataset, you can proceed to the next section. Alternatively, you can create an eventstream by uploading your own dataset. It must be represented as a csv-table with at least three columns (user_id, event, and timestamp). Upload your table as a pandas.DataFrame and create the eventstream as follows:
import pandas as pd
from retentioneering.eventstream import Eventstream

# load your own csv
data = pd.read_csv("your_own_data_file.csv")
stream = Eventstream(data)
If the input table columns have different names, either rename them in the DataFrame, or explicitly set data schema (see Eventstream user guide for the instructions). Likewise, if the table has additional custom columns, setting the data schema is also required.
Getting a CSV file with data#
If you use Google Analytics, raw data in the form of {user, event, timestamp} triples can be streamed via Google Analytics 360 or free Google Analytics App+Web into BigQuery. From the BigQuery console, you can run an SQL query and export data into a csv file. Alternatively, you can use the Python BigQuery connector to get directly into the DataFrame. For large datasets, we suggest sampling the users in an SQL query, filtering by the user_id (just add this condition to SQL WHERE statement to get 10% of your users:
and ABS(MOD(FARM_FINGERPRINT(fullVisitorId), 10)) = 0)
Preparing the data#
Raw data often needs to be prepared before analytical techniques are applied. Retentioneering provides a wide range of preprocessing tools that are comprised of elementary parts called “data processors.” With the help of data processors, a product analyst can easily add, delete, or group events, flexibly truncate an eventstream, split the trajectories into sessions, and much more. See the Data processors user guide for a comprehensive description of this Swiss army knife for data processors.
Below is a brief example of how the data processors work.
Suppose you wanted to analyze only the first session of each user, rather than their whole trajectory. Here is how you can do that with just a few lines of code:
# eventstream preprocessing example
stream \
    .split_sessions(timeout=(30, 'm')) \
    .filter_events(func=lambda df_, schema: df_['session_id'].str.endswith('_1')) \
    .to_dataframe() \
    .head()
| user_id | event | timestamp | session_id | |
|---|---|---|---|---|
| 0 | 219483890 | session_start | 2019-11-01 17:59:13.273932 | 219483890_1 |
| 1 | 219483890 | catalog | 2019-11-01 17:59:13.273932 | 219483890_1 |
| 3 | 219483890 | product1 | 2019-11-01 17:59:28.459271 | 219483890_1 |
| 5 | 219483890 | cart | 2019-11-01 17:59:29.502214 | 219483890_1 |
| 7 | 219483890 | catalog | 2019-11-01 17:59:32.557029 | 219483890_1 |
At the beginning, we take a stream variable that contains the eventstream instance created in the previous section. The split_sessions method creates a new column called session_id, in which values ending with the suffix _<int> indicate the ordinal number of each user’s session. In the end, we need to leave only those records where session_id ends with _1 (meaning the first session). This is exactly what the filter method does. We also apply the to_dataframe() method, which you are already familiar with.
In real life, analytical eventstream research is likely to be branchy. You might want to wrangle an initial eventstream’s data in many ways, check multiple hypotheses, and look at different parts of the eventstream. All of this is easily and efficiently managed using the preprocessing graph. It enables you to keep all the records and code related to the research in a calculation graph. This tool is especially recommended for those who need to share parts of the analytical code with team members. See the Preprocessing user guide for more details.
Applying path analysis tools#
Retentioneering offers many powerful tools for exploring the behavior of your users, including transition graphs, step matrices, step Sankey diagrams, funnels, cluster, and cohort analysis. A brief demo of each is presented below. For more details, see the user guides.
Transition graph#
Transition graph is an interactive tool that shows how many users jump from one event to another. It represents user paths as a Markov random walk model. The graph is interactive: you can drag the graph nodes, zoom in and out of the graph layout, or use a control panel on the left edge of the graph. The transition graph also allows you to highlight the most valuable nodes, and hide noisy nodes and edges.
stream.transition_graph()
See Transition graph user guide for a deeper understanding of this tool.
Step matrix#
The step matrix provides a stepwise look at CJM. It shows the event distribution with respect to a step ordinal number.
stream.step_matrix(
    max_steps=16,
    threshold=0.2,
    centered={
        'event': 'cart',
        'left_gap': 5,
        'occurrence': 1
    },
    targets=['payment_done']
)
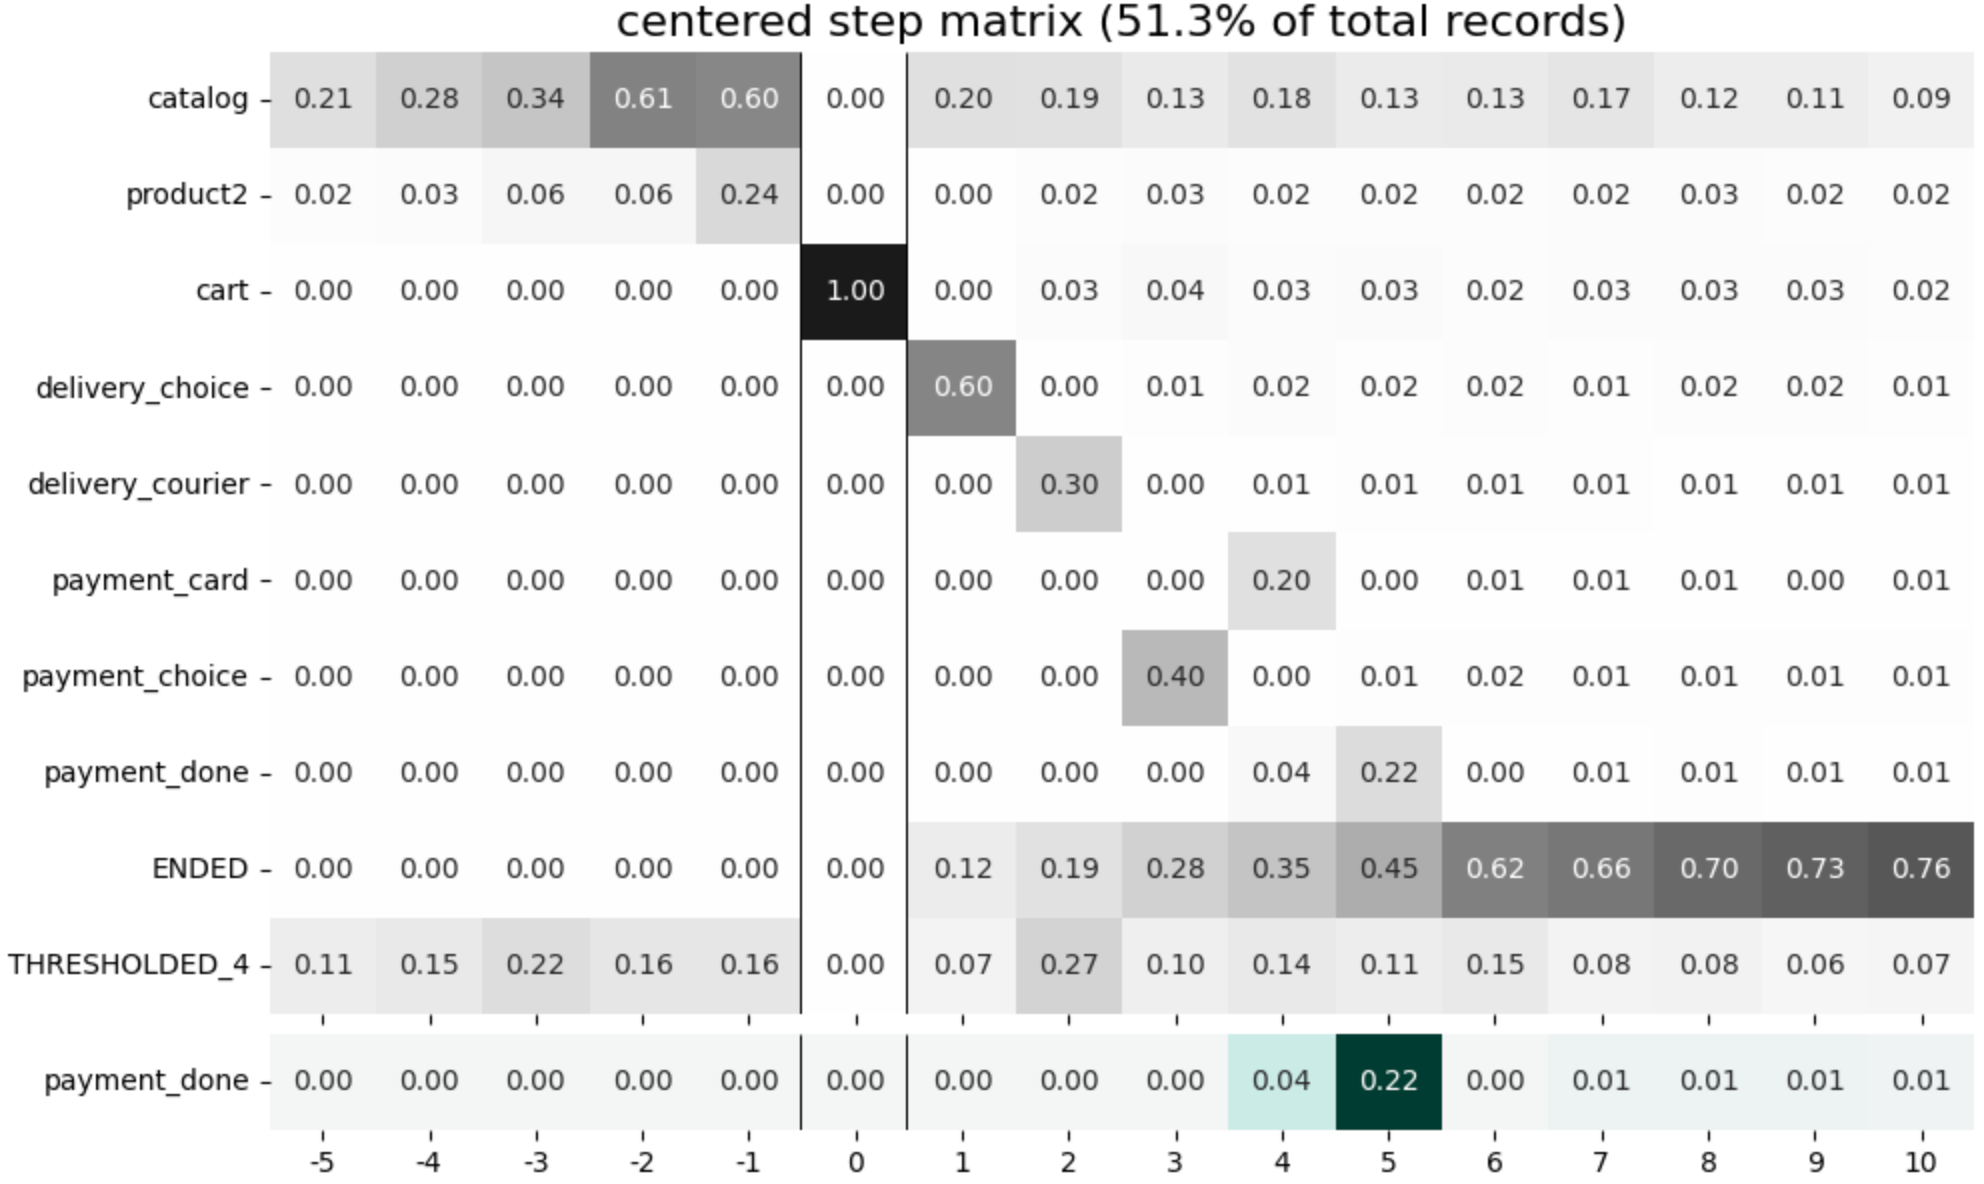
The step matrix above is centered by cart event. For example, it shows (see column -1) that the events in the user trajectories one step before cart event are distributed as follows: 60% of the users have catalog event right before cart, 24% of the users have product2 event, and 16% of the users are distributed among 5 events which are folded to an artificial THRESHOLDED_5 event.
See Step matrix user guide user guide for a deeper understanding of this tool.
Step Sankey diagram#
The step Sankey diagram is similar to the step matrix. It also shows the event distribution with respect to step number. However, it has some more advanced features:
it explicitly shows the user flow from one step to another; and
it is interactive.
stream.step_sankey(max_steps=6, threshold=0.05)
See step Sankey user guide for a deeper understanding of this tool.
Cluster analysis#
from retentioneering.tooling.clusters import Clusters

clusters = Clusters(stream)
features = clusters.extract_features(feature_type='tfidf', ngram_range=(1, 2))
clusters.fit(method='kmeans', n_clusters=8, X=features)
clusters.plot(targets=['payment_done', 'cart'])
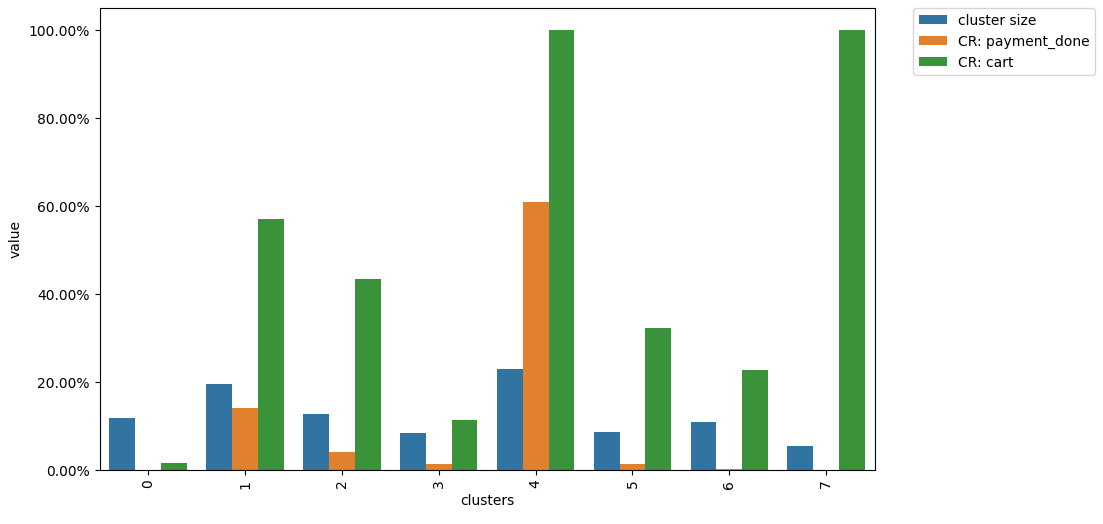
Users with similar behavior are grouped in the same cluster. Clusters with low conversion rates can indicate a systematic problem in the product: a specific behavior pattern that does not lead to product goals. The obtained user segments can be explored in more depth to understand the problematic behavior patterns. In the example above for instance, cluster 4 has a low conversion rate to payment_done, but a high conversion rate to cart visit.
See Clusters user guide for a deeper understanding of this tool.
Funnel analysis#
Building a conversion funnel is a basic part of much analytical research. Funnel is a diagram that shows how many users sequentially walk through specific events (funnel stages) in their paths. For each stage event, the following values are calculated:
absolute unique number of users who reached this stage at least once;
conversion rate from the first stage (% of initial); and
conversion rate from the previous stage (% of previous).
stream.funnel(stages=['catalog', 'cart', 'payment_done'])
See Funnel user guide for a deeper understanding of this tool.
Cohort analysis#
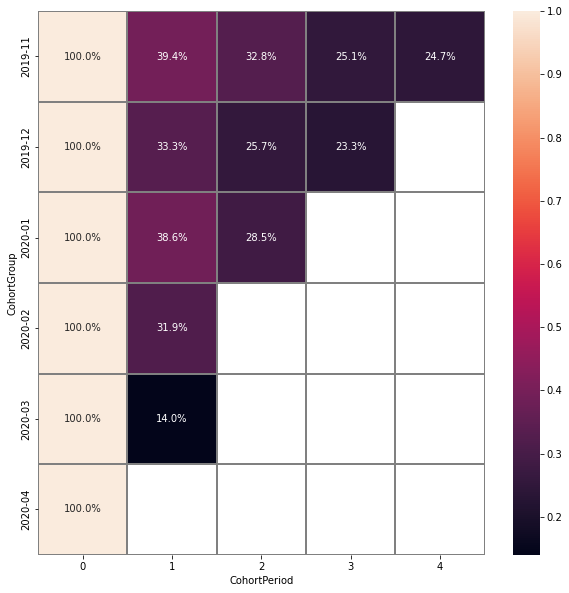
Cohorts is a powerful tool that shows trends of user behavior over time. It helps to isolate the impact of different marketing activities, or changes in a product for different groups of users.
Here is an outline of the cohort matrix calculation:
Users are split into groups (
CohortGroups) depending on the time of their first appearance in the eventstream; andThe retention rate of the active users is calculated in each period (
CohortPeriod) of the observation.
stream.cohorts(
    cohort_start_unit='M',
    cohort_period=(1, 'M'),
    average=False,
)
See Cohorts user guide for a deeper understanding of this tool.
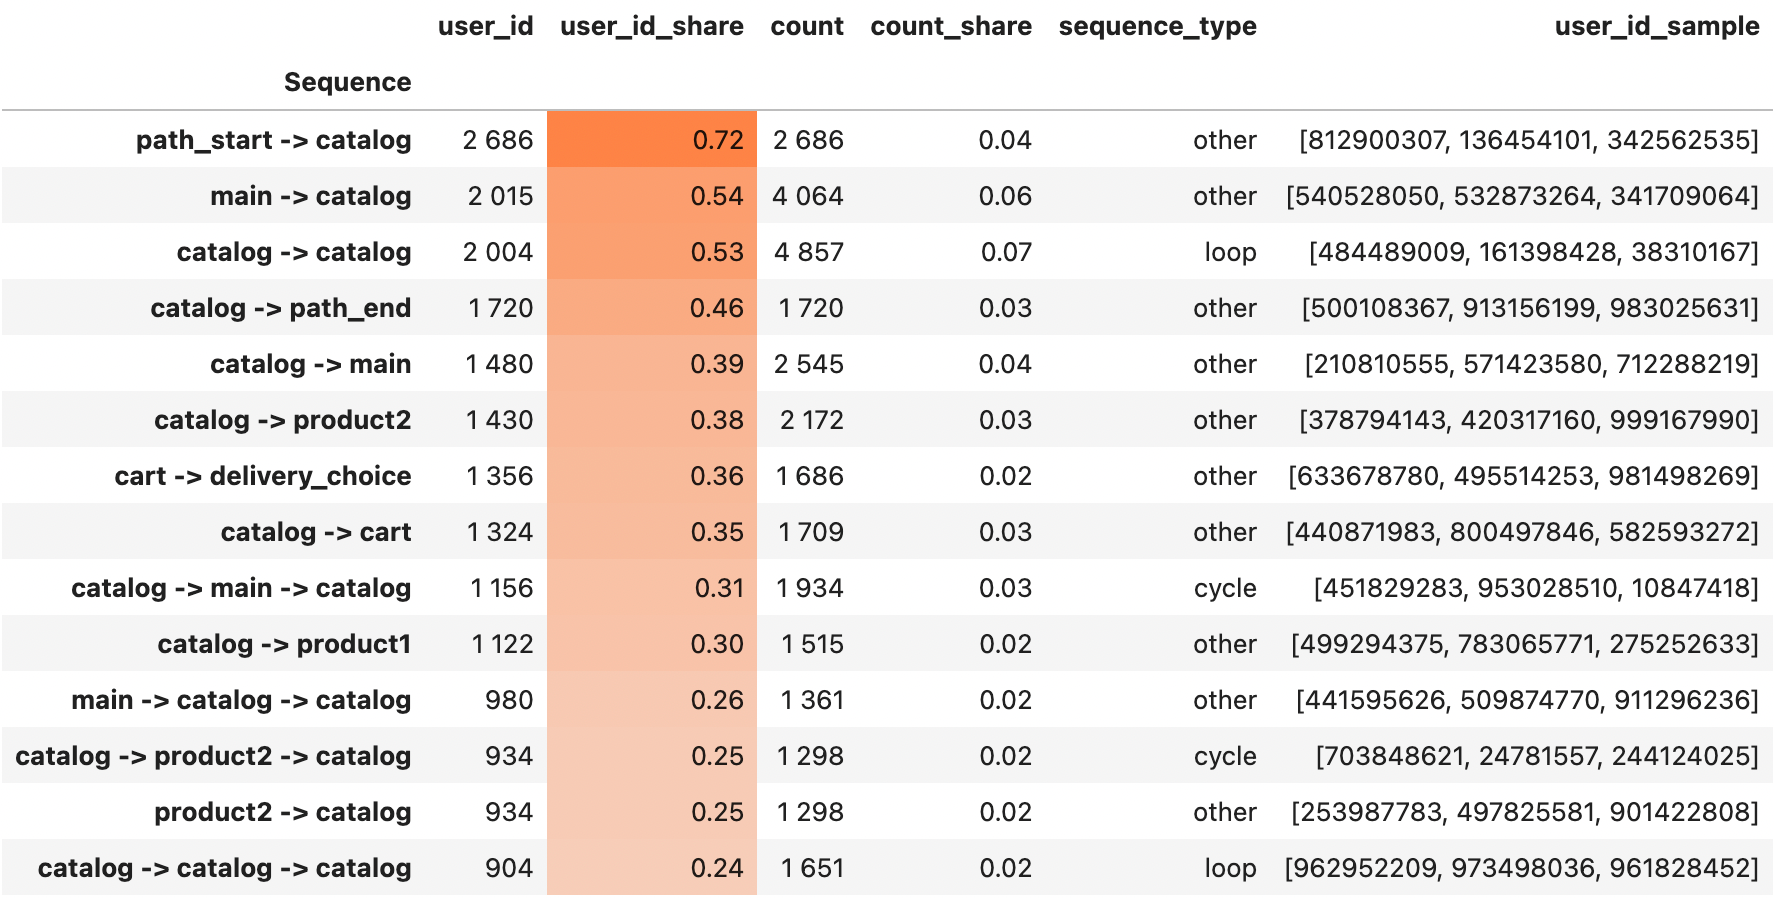
Sequence analysis#
Sequences tool aims to calculate frequency statistics regarding each particular n-gram represented in an eventstream. It supports group comparison.
stream.sequences(
    ngram_range=(2, 3),
    threshold=['count', 1200],
    sample_size=3
)
See Sequences user guide for the details.